Back chapter figures
Figure 3.4
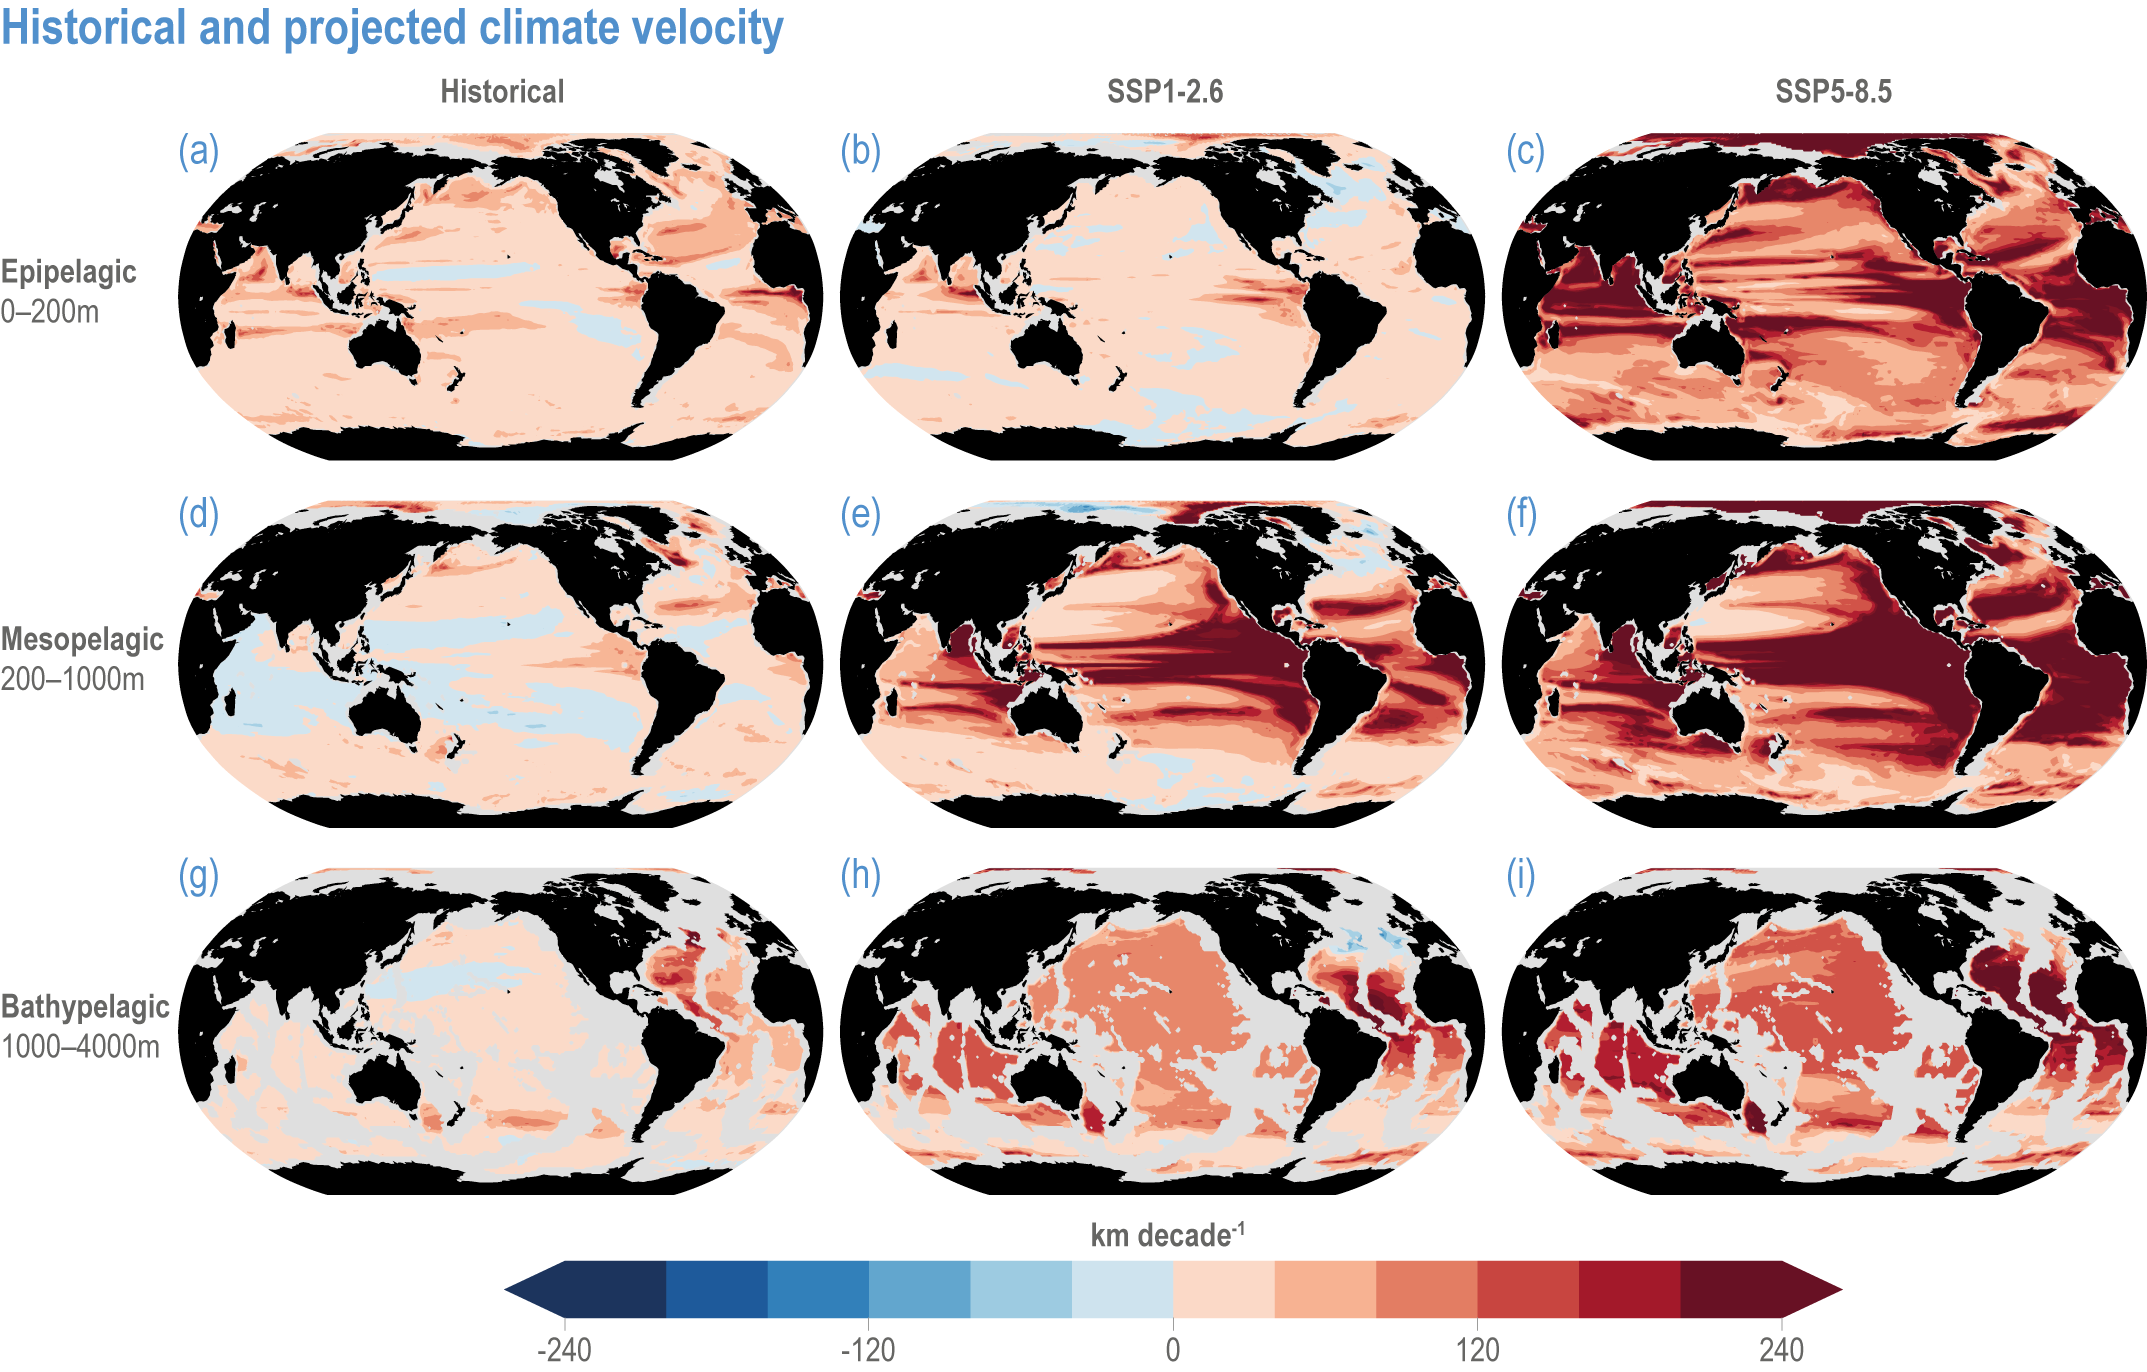
Figure caption
Figure 3.4 | Historical and projected climate velocity. Climate velocities (in kilometres per decade) are shown for the (a,d,g) historical period (1965–2014), and the last 50 years of the 21st century (2051–2100), under (b,e,h) SSP1-2.6 and (c,f,i) SSP5-8.5. Also shown are the epipelagic (0–200 m), mesopelagic (200–1000 m) and bathypelagic (1000–4000 m) domains. Updated figure from Brito-Morales et al. (2020), with Coupled Model Intercomparison Project 6 models used in Kwiatkowski et al. (2020).