Figure 3.16
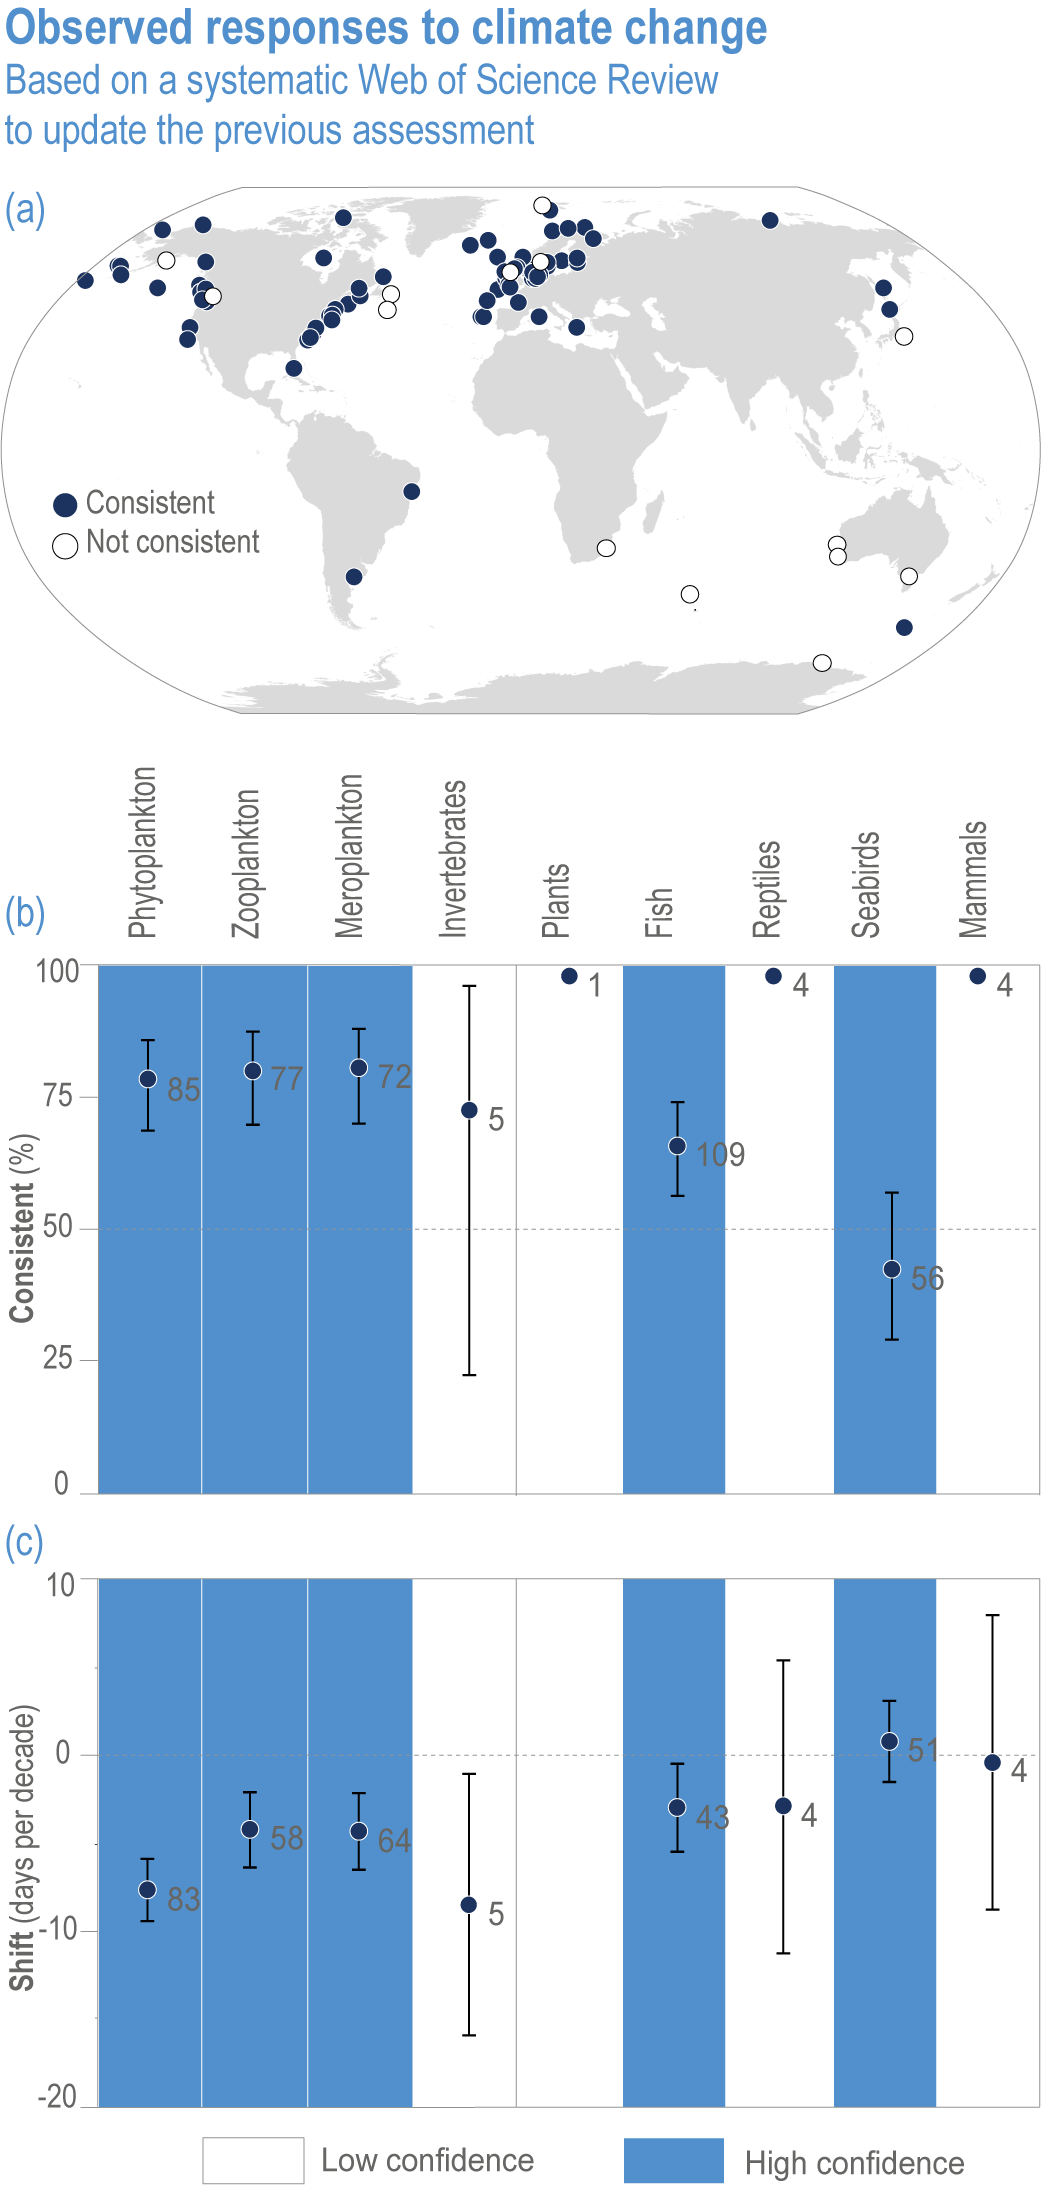
Figure caption
Figure 3.16 | Observed responses to climate change based on a systematic Web of Science review of marine phenology studies exceeding 19 years in length to update the assessment in WGII AR5 Chapter 30 (Hoegh-Guldberg et al. , 2014). Error bars indicate 95% confidence limits (i.e., the extremely likely range).
(a) Global data shows changes in seasonal cycles of biota that are attributed (at least partly) to climate change (blue, n= 297 observations), and changes that are inconsistent with climate change (white, n= 116 observations). Each circle represents the centre of a study area.
(b) The proportion of phenological observations (showing means and extremely likely ranges) that are attributed to climate change (i.e., generally showing earlier timing) by taxonomic group.
(c) Observed shifts in timing (days per decade, showing means and extremely likely ranges), by taxonomic group, that are attributed to climate change. Negative shifts are earlier, positive shifts are later. (Details and additional plots are presented in 3.SM.3.3, Figure 3.SM.3 and Table 3.SM.1.)