Figure 3.17
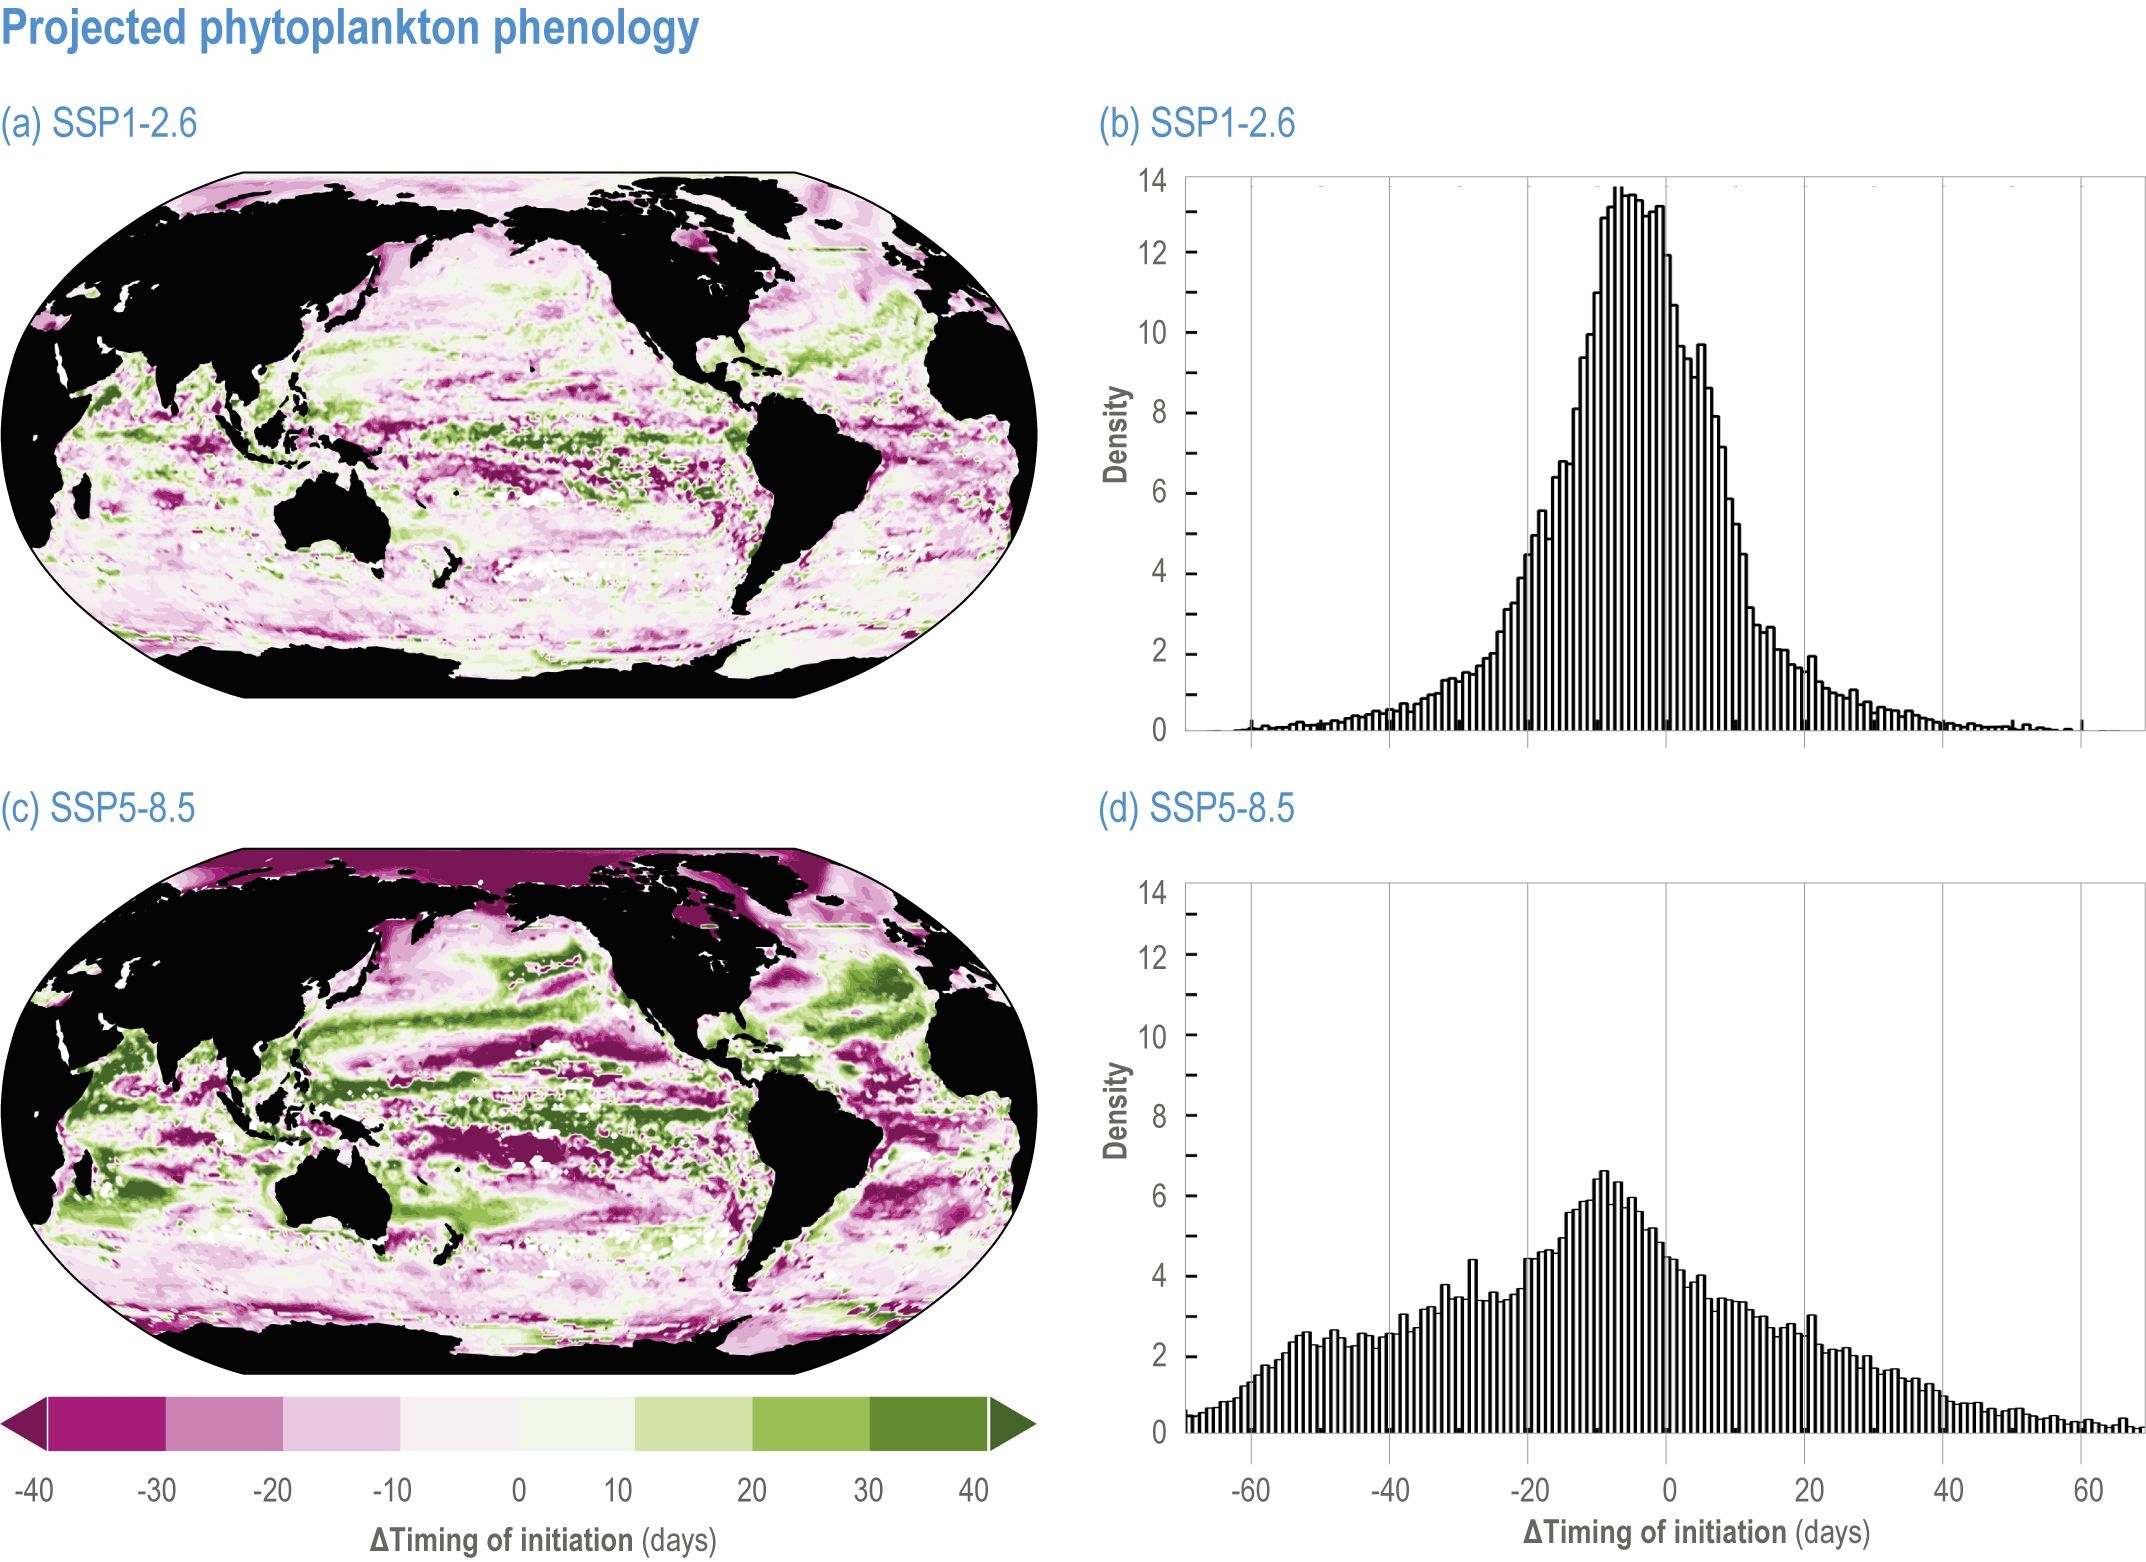
Figure caption
Figure 3.17 | Projected phytoplankton phenology. (a,c) Spatial patterns and (b,d) density distributions of projected change in phytoplankton phenology by 2100 under Shared Socioeconomic Pathway (SSP)1-2.6 and SSP5-8.5, respectively. Difference in the start of the phytoplankton growth period is calculated as 2090–2099 minus 1996–2013. Negative (positive) values indicate earlier (later) start of the phytoplankton growth period by 2100. The ensemble projections of global changes in phytoplankton phenology include, under SSP1-2.6 and SSP5-8.5, respectively, a total of five Coupled Model Intercomparison Project 6 Earth system models containing coupled ocean biogeochemical models that cover a wide range of complexity (Kwiatkowski et al., 2019). (The phenology calculations are based on Racault et al., 2017, using updated data.)