Figure 3.18
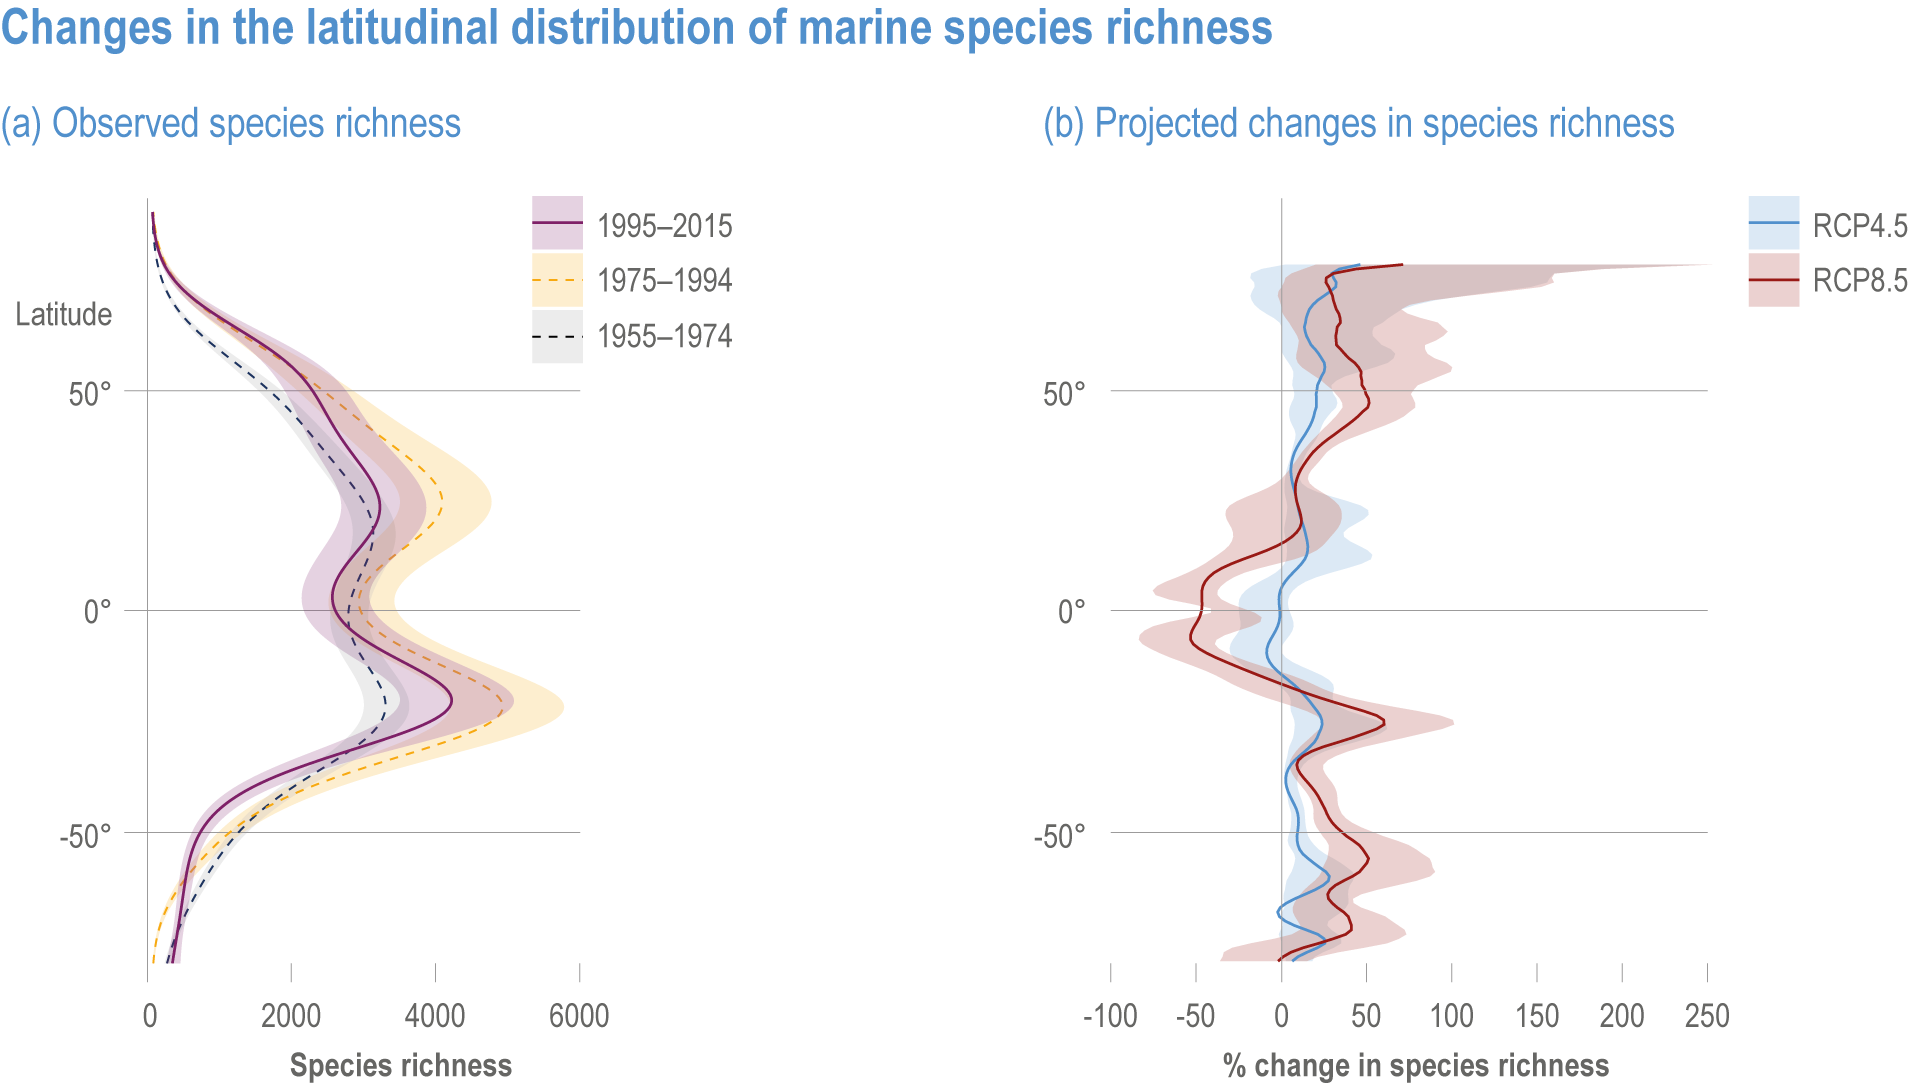
Figure caption
Figure 3.18 | Changes in the latitudinal distribution of marine species richness.
(a) Observed species richness for three historical periods. The observed latitudinal patterns in species richness are for a suite of taxonomic groups based on 48,661 marine species (Chaudhary et al., 2021).
(b) Projected changes in species richness under RCP4.5 and RCP8.5 are calculated as differences by grid cell by 2100 relative to 2006. Latitudinal global median (5° moving average). (Based on Figure 1b,c in García Molinos et al., 2016.) The projected latitudinal patterns in changes in species richness under climate change are based on a numerical model that includes species-specific information across a suite of taxonomic groups, based on 12,796 marine species (García Molinos et al., 2016).