Figure 3.21
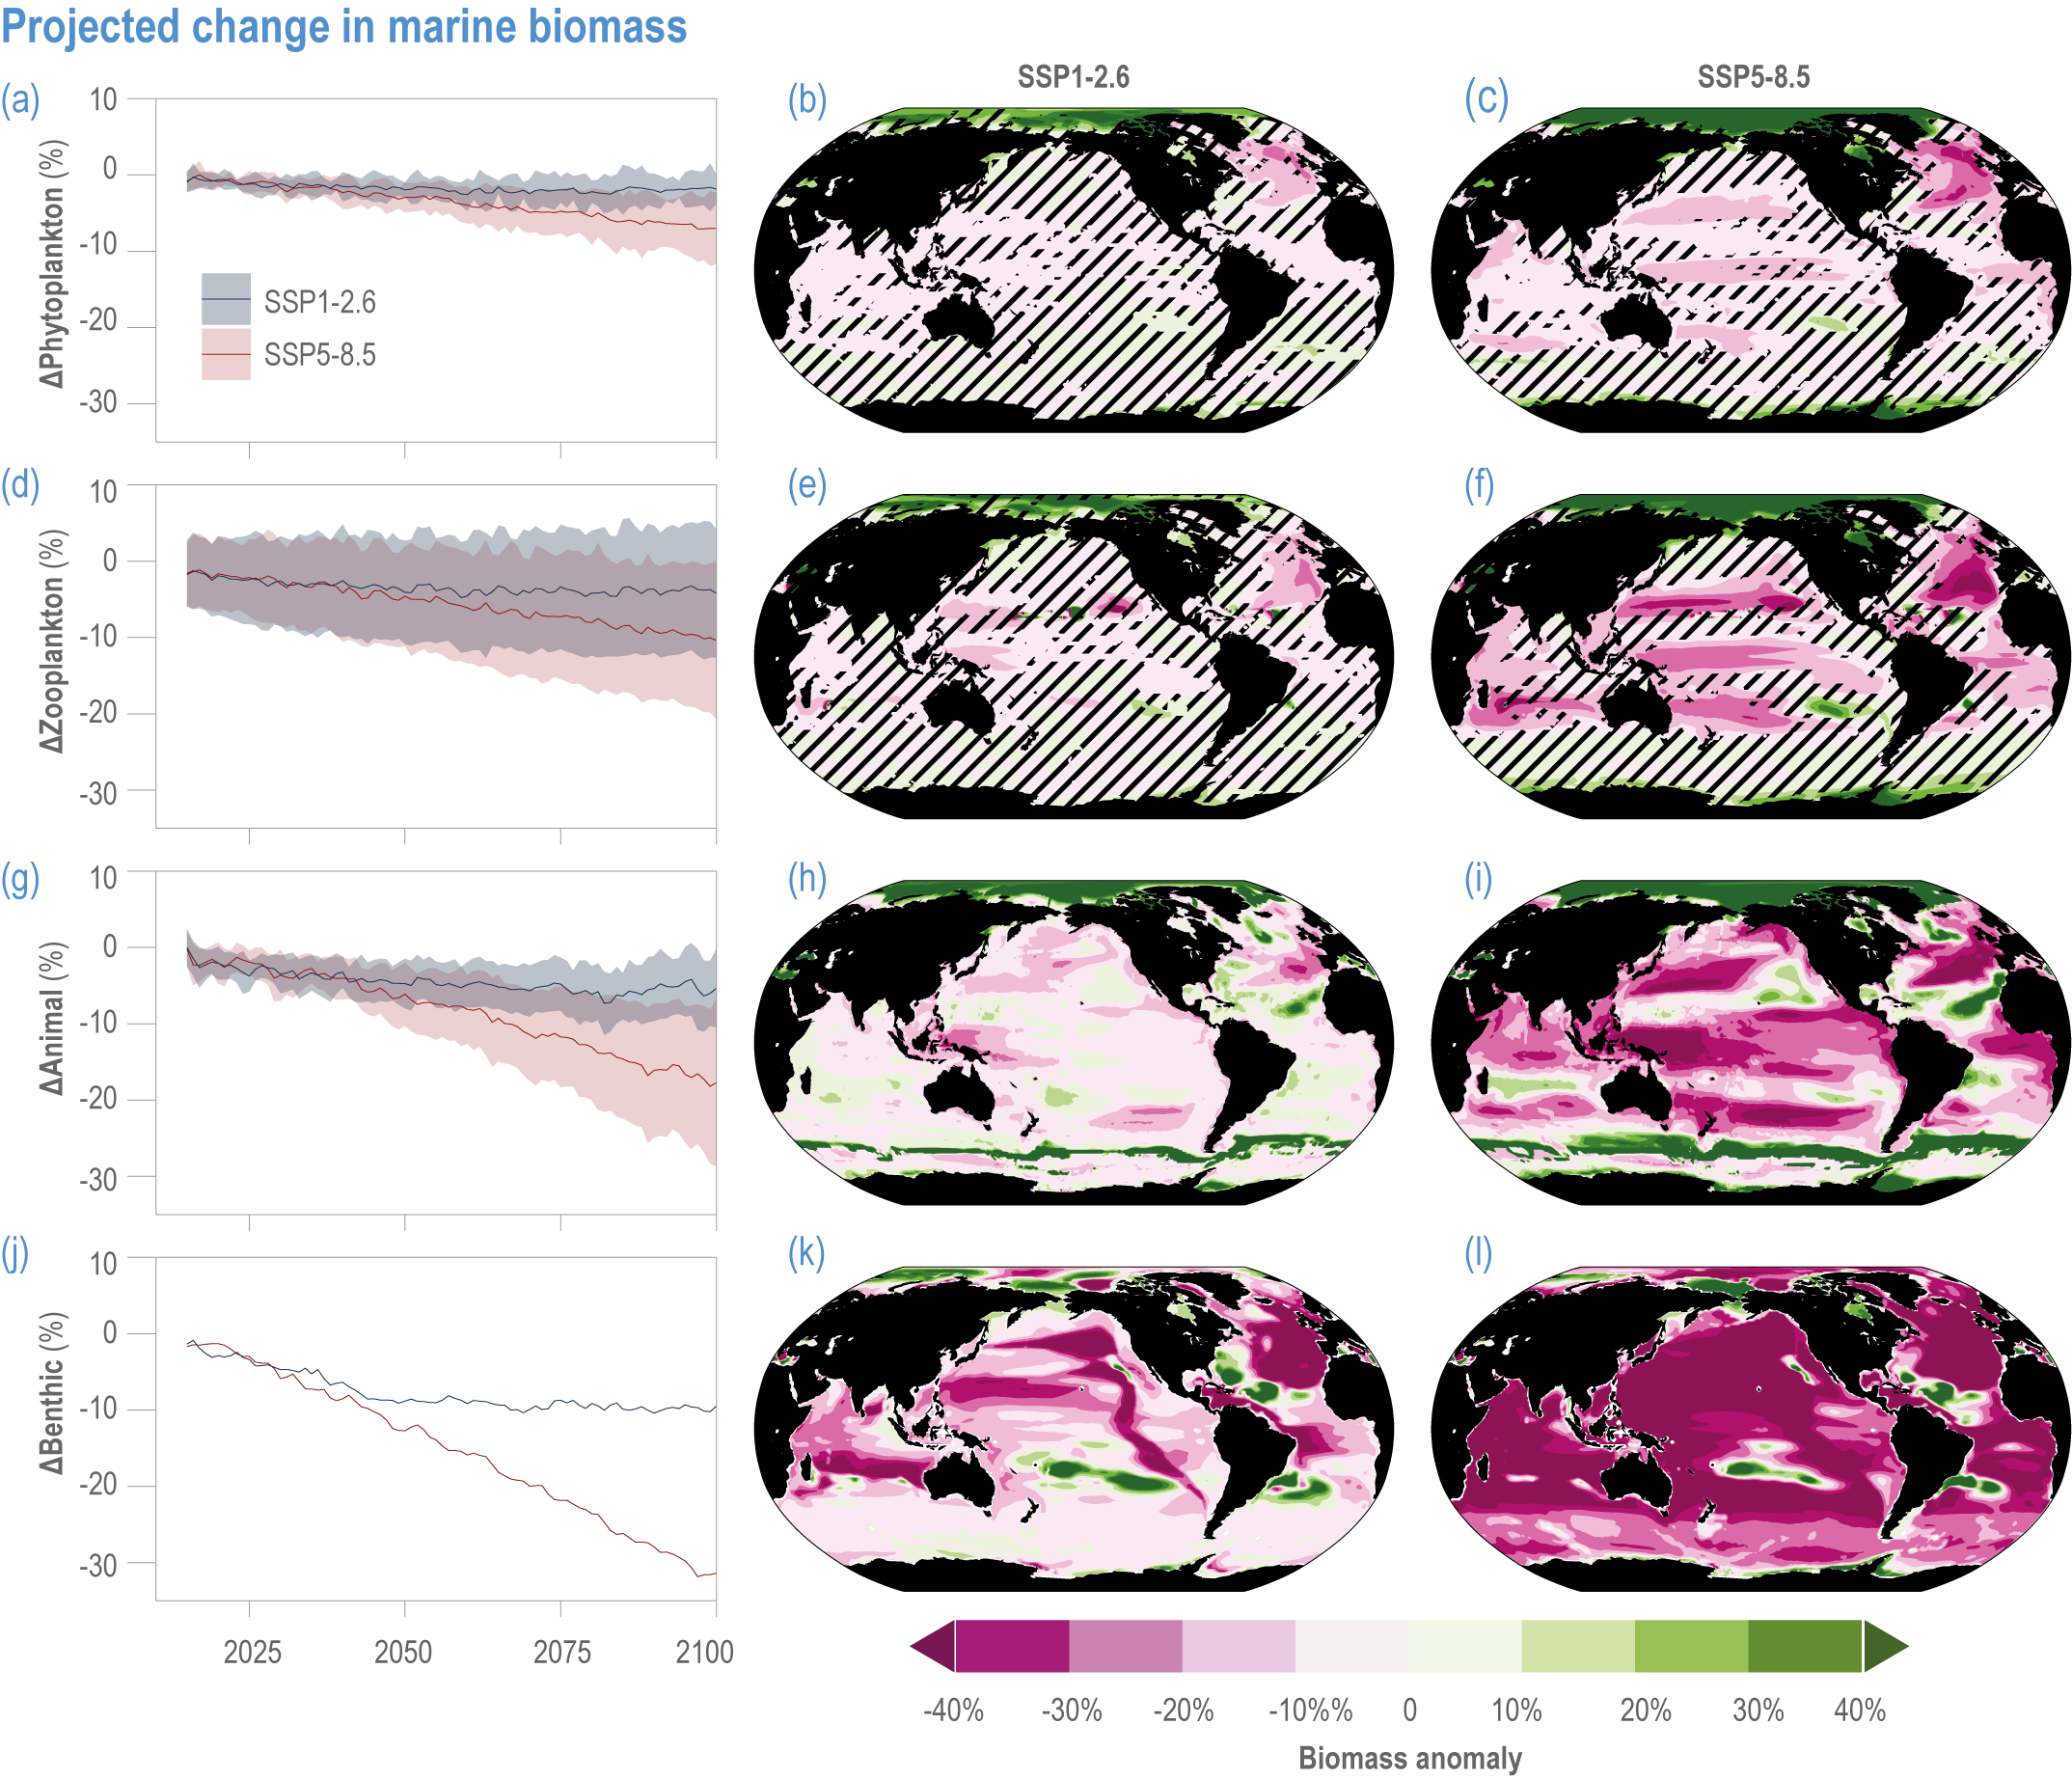
Figure caption
Figure 3.21 | Projected change in marine biomass. Simulated global biomass changes of (a,b,c) surface phytoplankton, (d,e,f) zooplankton, (g,h,i) animals and (j,k,l) seafloor benthos. In (a,d,g,j), the multi-model mean (solid lines) and very likely range (envelope) over 2000–2100 relative to 1995–2014, for SSP1-2.6 and SSP5-8.5. Spatial patterns of simulated change by 2090–2099 are calculated relative to 1995–2014 for (b,e,h,k) SSP1-2.6 and (c,f,i,l) SSP5-8.5. Confidence intervals can be affected by the number of models available for the Coupled Model Intercomparison Project 6 (CMIP6) scenarios and for different variables. Only one model was available for panel (j), so no confidence interval is calculated. For panels (a–f), the ensemble projections of global changes in phytoplankton and zooplankton biomasses updated based on Kwiatkowski et al. (2019) include, under SSP1-2.6 and SSP5-8.5, respectively, a total of nine and ten CMIP6 Earth system models (ESMs). For panels (b,c,e,f), unhatched areas represent regions where at least 80% of models agree on the sign of biomass anomaly. For panels (g,h,i), the ensemble projections of global changes in total animal biomass updated based on Tittensor et al. (2021) include six to nine published global fisheries and marine ecosystem models from the Fisheries and Marine Ecosystem Model Intercomparison Project (Tittensor et al., 2018; Tittensor et al., 2021), forced with standardised outputs from two CMIP6 ESMs. For panels (j,k,l), globally integrated changes in total seafloor biomass have been updated based on Yool et al. (2017) with one benthic model (Kelly-Gerreyn et al., 2014) forced with the CMIP6 ESM UKESM-1.