Figure 4.3
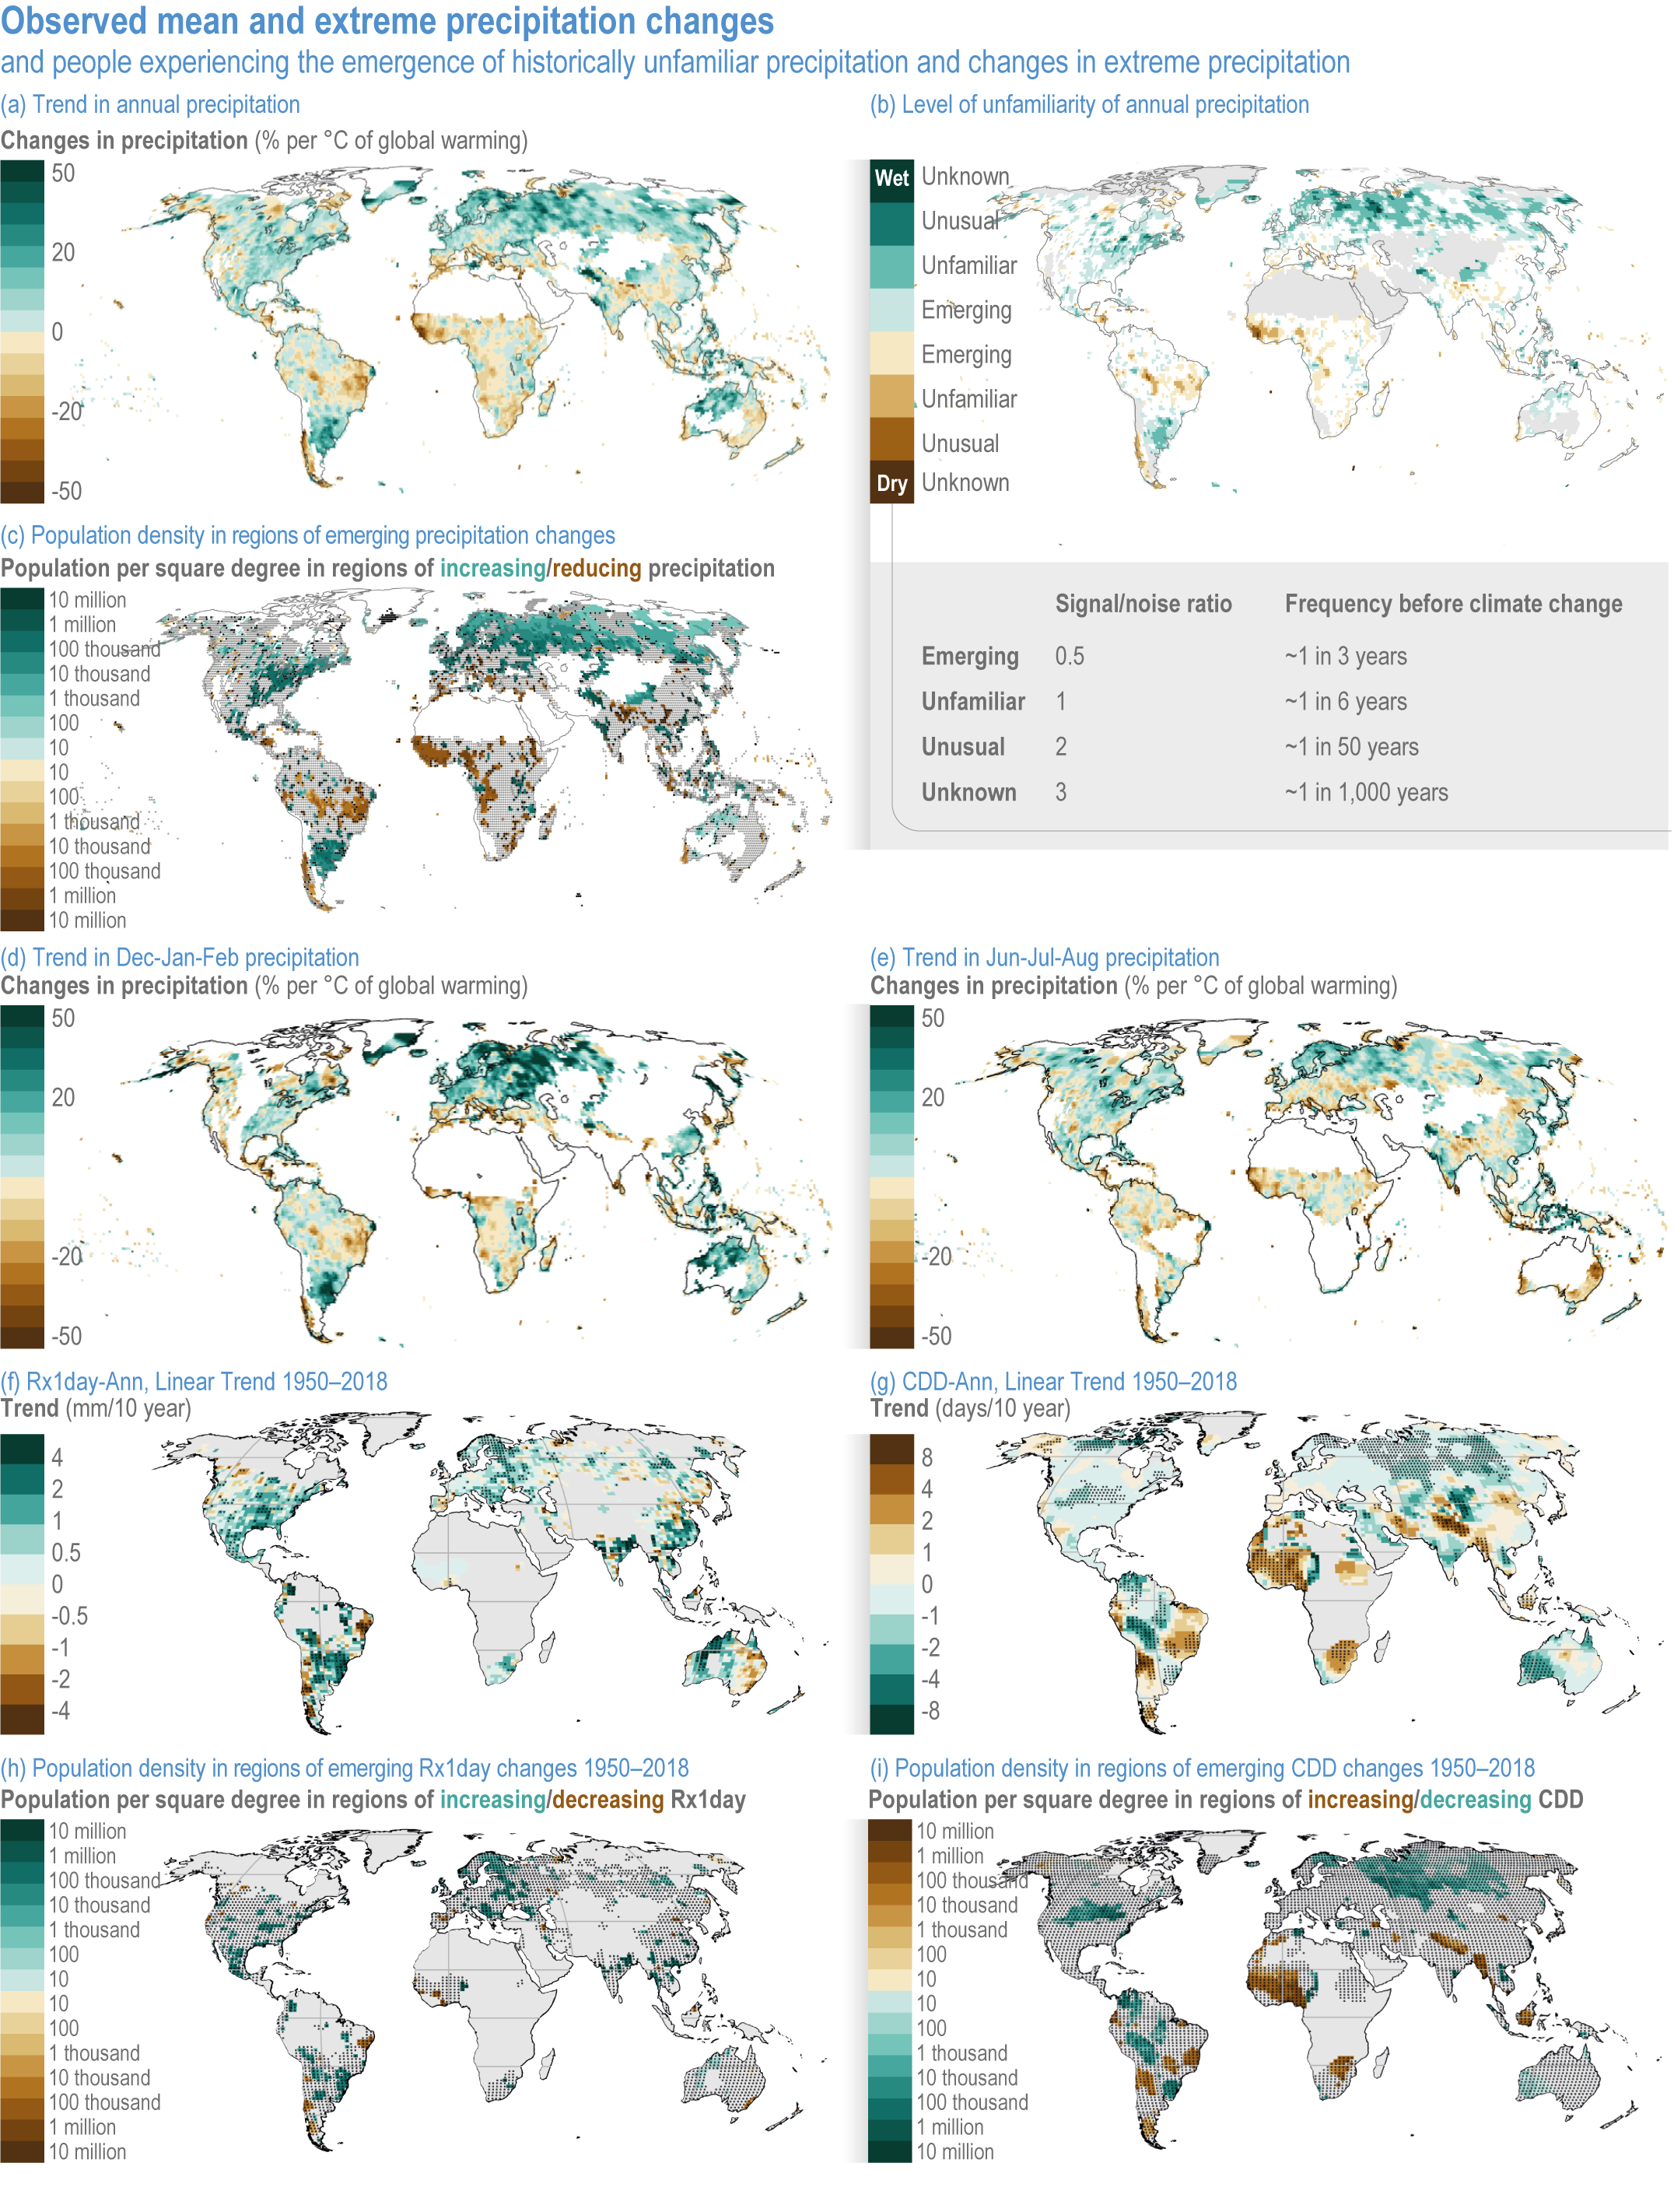
Figure caption
(a) Percentage changes in annual mean precipitation over land (1891–2019) per °C global warming in the Global Precipitation Climatology Centre (GPCC) v2020 data set (Schneider et al., 2017; Schneider et al., 2020). Green shows increasing precipitation; orange shows decreasing precipitation.
(b) Levels of unfamiliarity of wetter and drier climates, classified in terms of the ratio of the signal S of change to the noise N of variability, where the latter is defined as one standard deviation in annual data with the trend removed, that is, occurs approximately one in 6 years. Grey regions are either unobserved (oceans) or deserts (<250 mm year –1). Stippling indicates where the signal of change is not significant. See Hawkins et al. (2020) for further details.
(c) Population densities in regions with annual precipitation classified as “emerging”.
(d) Precipitation trends from the GPCC data set in December, January and February (mm day –1 decade –1).
(e) As (d) for June-July-August.
(f) Changes in annual maximum 1-day precipitation (Rx1day) in the HadEX3 data set (Dunn et al., 2020).
(g) Trend in annual mean consecutive dry days (CDD), 1950–2018, in HadEX3.
(h) Population densities per grid box where the trend in Rx1day is significantly different from zero.
(i) Population densities per grid box where the trend in CDD is significantly different from zero. Stipples in (h) and (i) show where HadEX3 data is available. Population data in (c), (h) and (i) are for 2020 from CIESIN (2018a; 2018b).