Figure 4.7
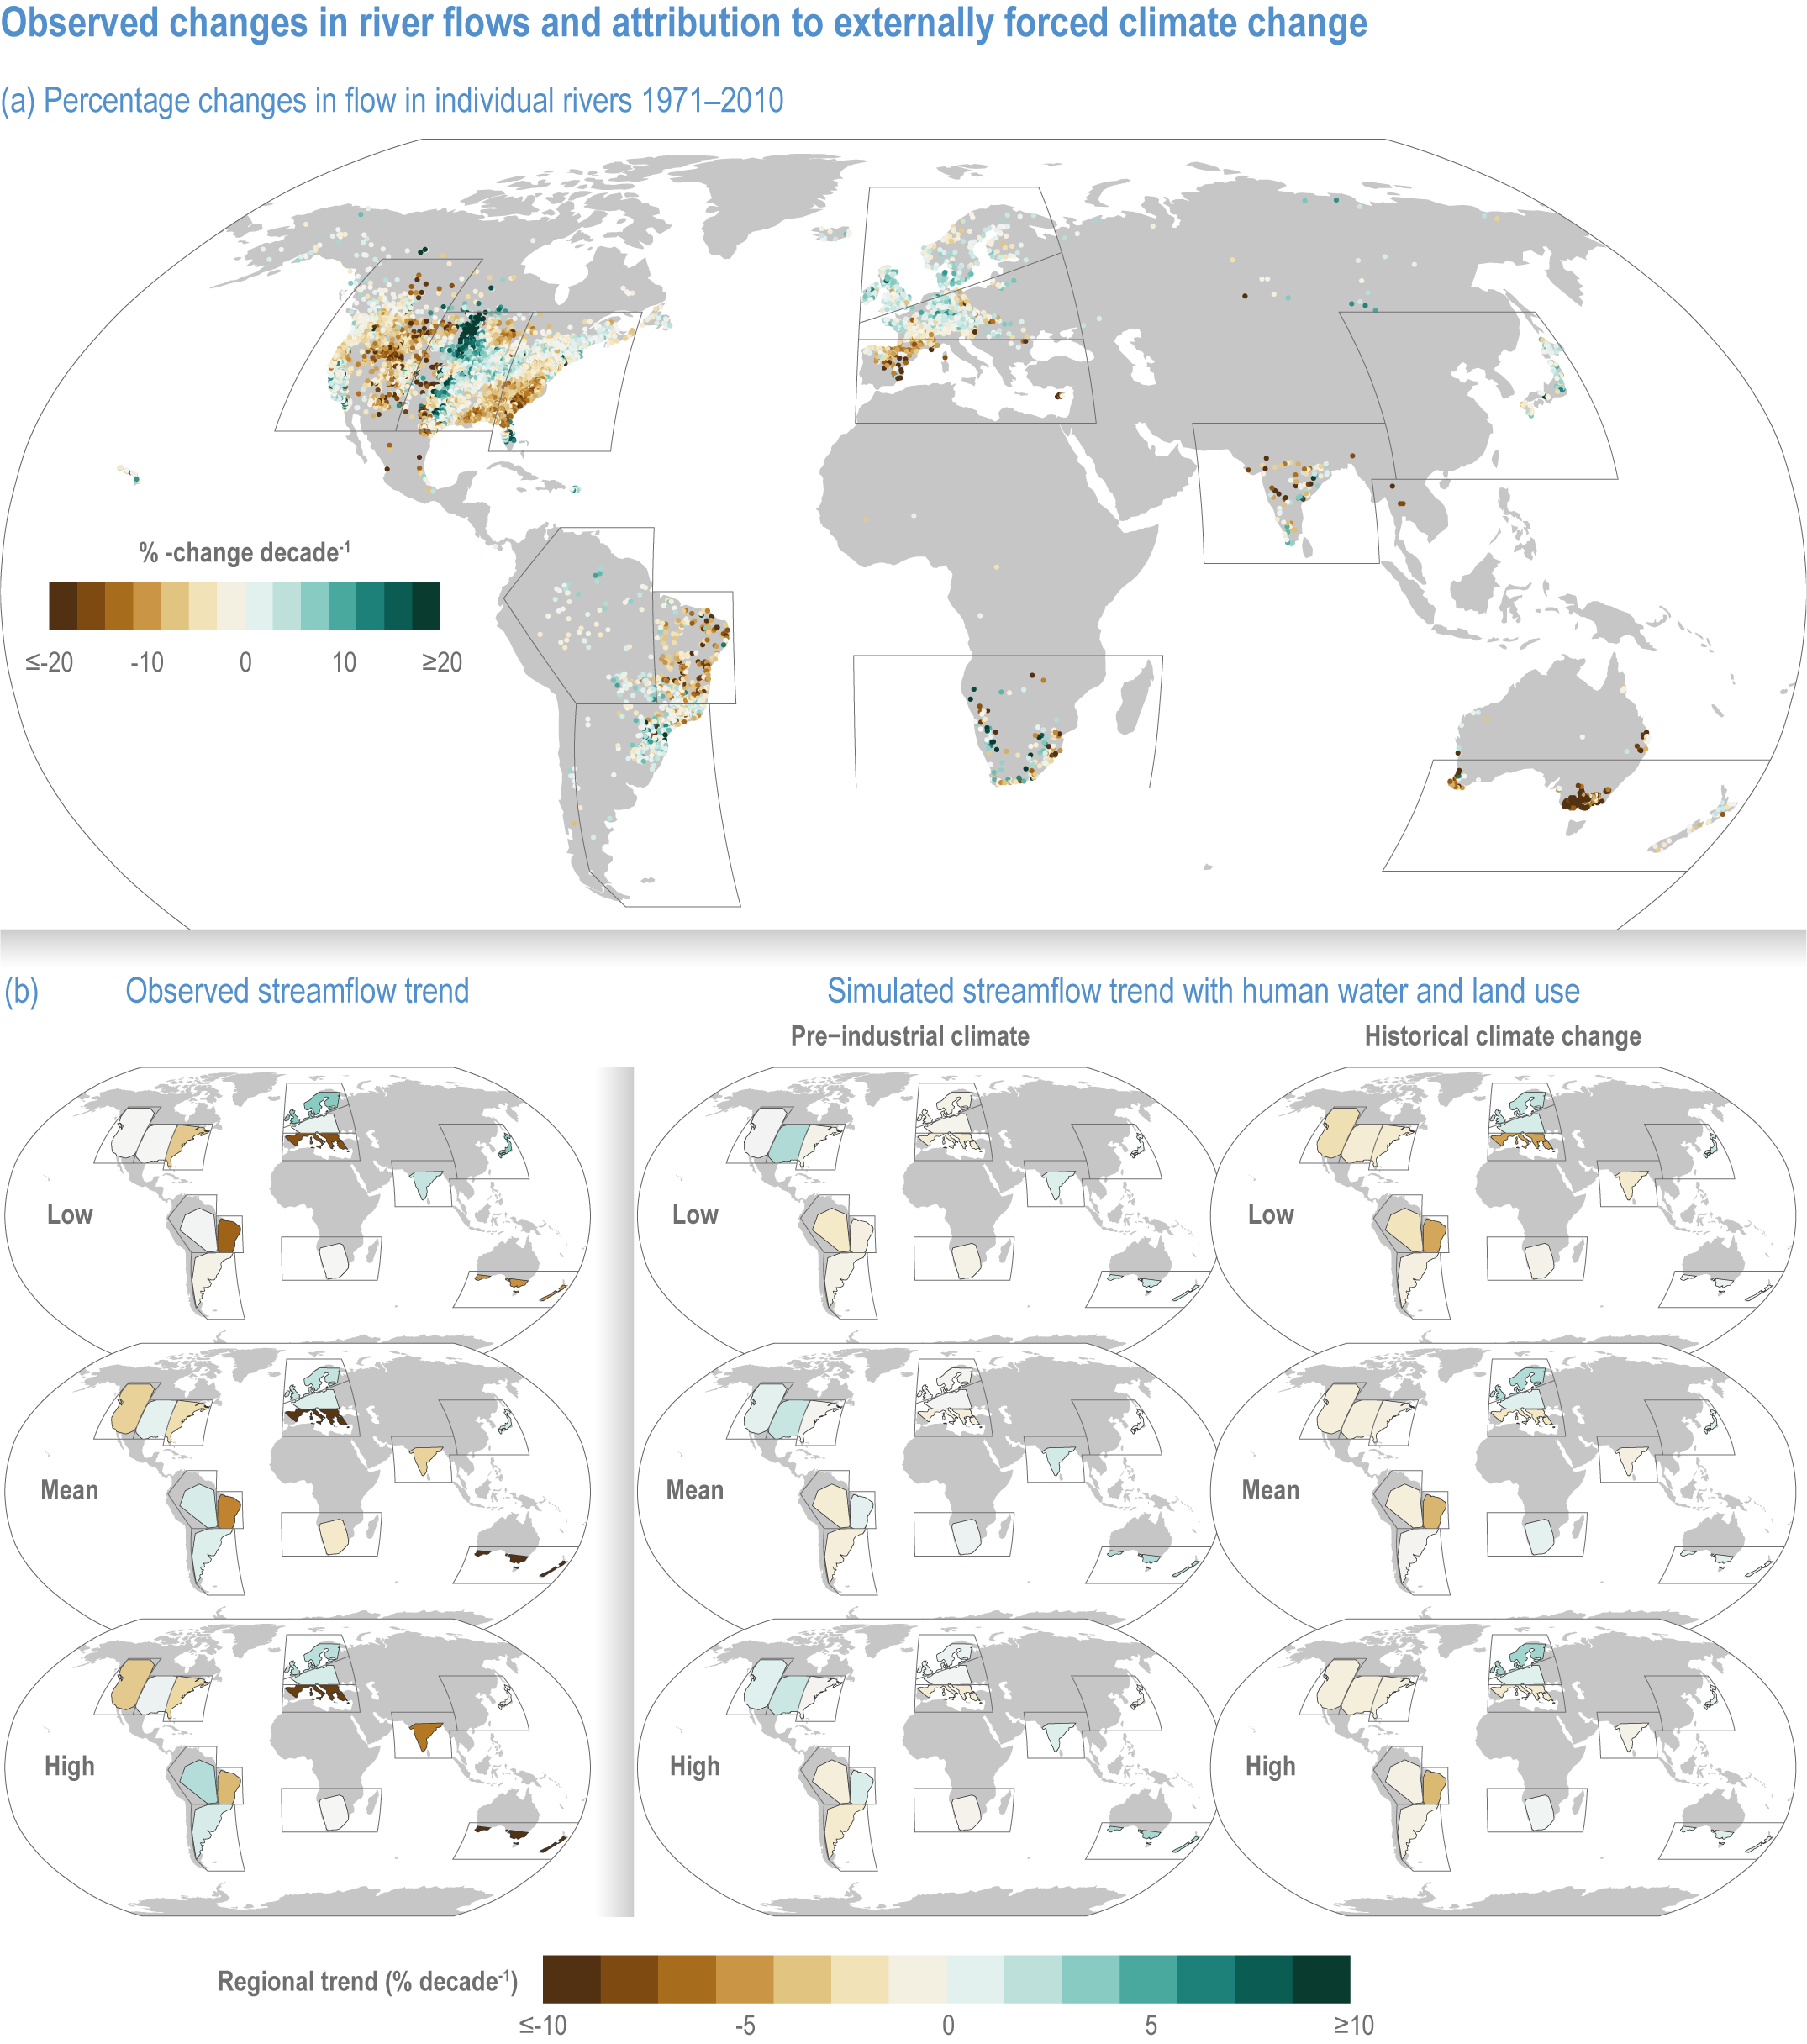
Figure caption
Figure 4.7 | Observed changes in river flows and attribution to externally forced climate change.
(a) Percentage changes in flow in individual rivers 1971 to 2010. Black box outlines show climatic regions with at least 80 gauging stations with almost complete daily observations over 1971–2010, using the SREX (Seneviratne et al., 2012) regions.
(b) Left column: observed regional median trends from 1971 to 2010 in SREX regions with at least 80 gauging stations with almost complete daily observations over that period. Middle column: trends simulated by eight global hydrological models driven by four CMIP5 Earth System Models, with human water and land use from 1971 to 2020 and the pre-industrial control climate state. Right column: same as the middle column but with ESM-simulated climates from 1971 to 2010 with both anthropogenic forcings (greenhouse gases, aerosols and land use) and natural external forcings (solar variability and volcanic eruptions). Top row: low flows (annual 10th percentile). Middle row: mean flows. Bottom row: high flows (annual 90th percentile). Reproduced from Gudmundsson et al. (2021).