Figure 4.9
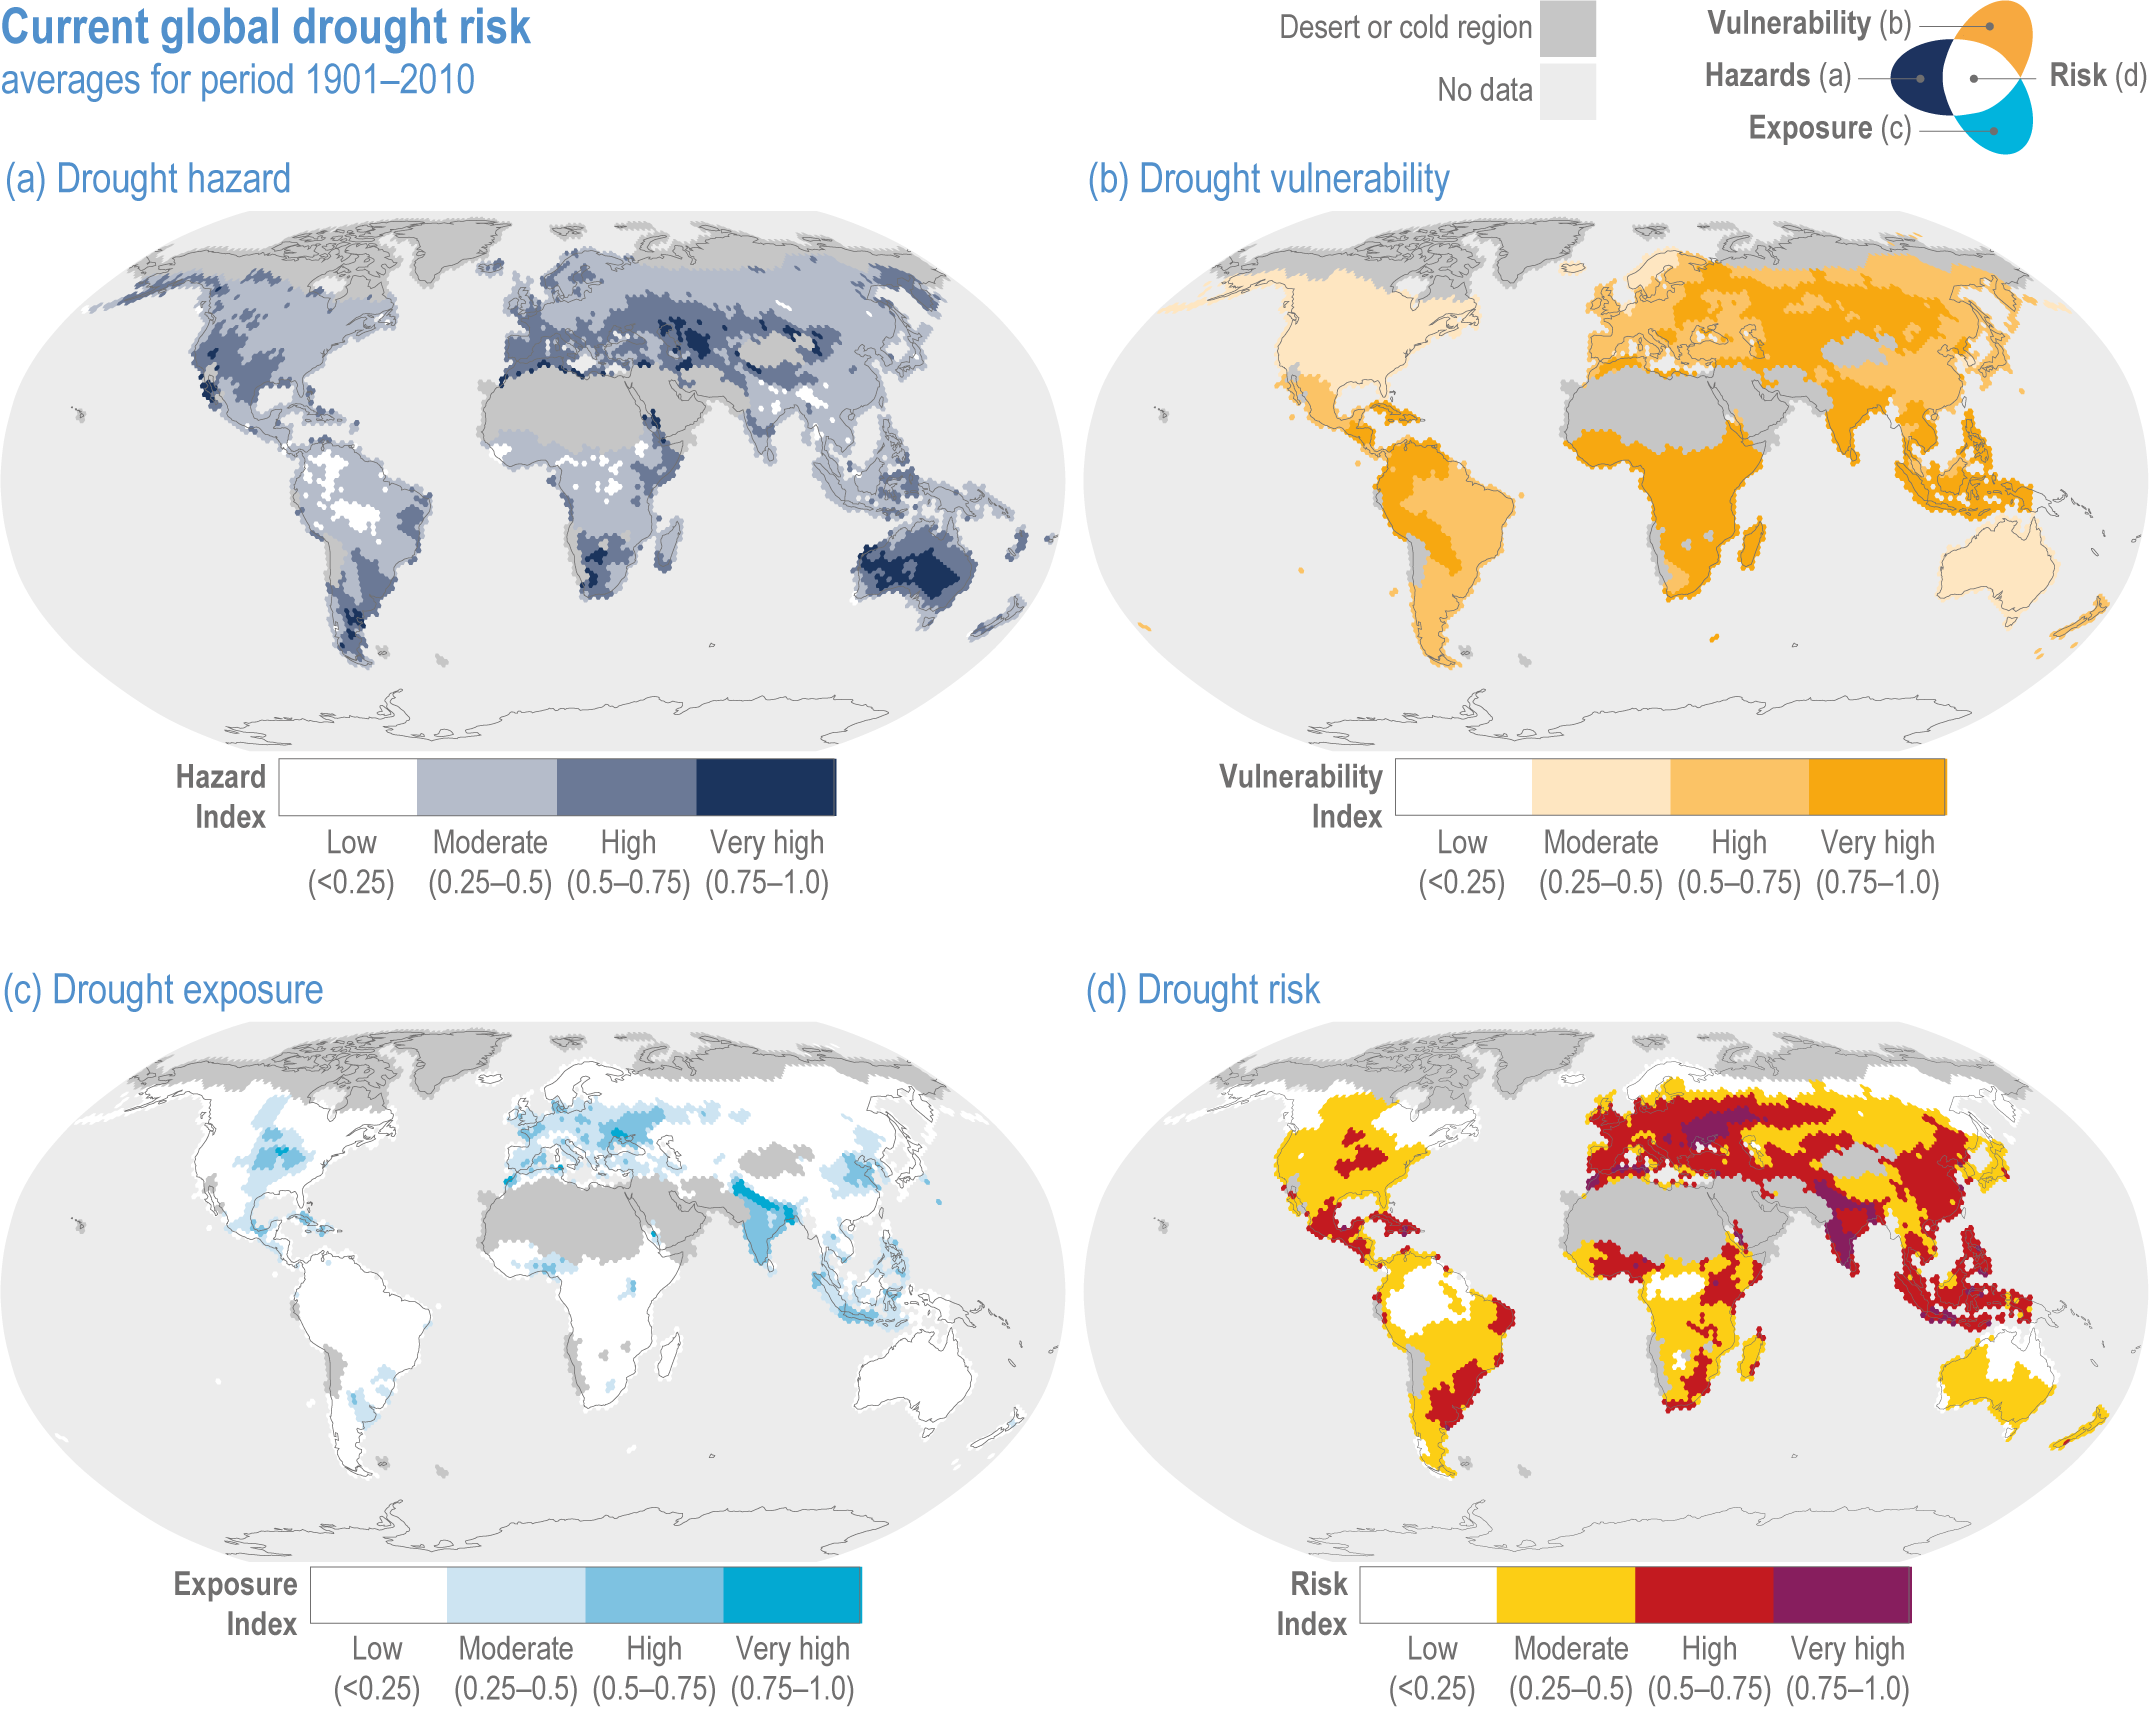
Figure caption
Figure 4.9 | Current global drought risk and its components.
(a) Drought hazard computed for the events between 1901 and 2010 by the probability of exceedance the median of global severe precipitation deficits, using precipitation data from the Global Precipitation Climatology Centre (GPCC) for 1901–2010.
(b) Drought vulnerability is derived from an arithmetic composite model combining social, economic and infrastructural factors proposed by the United Nations International Strategy for Disaster Risk Reduction (UNISDR, 2004).
(c) Drought exposure computed at the sub-national level with the non-compensatory Data Envelopment Analysis (DEA) model (Cook et al., 2014).
(d) Drought risk based on the above components of hazard, vulnerability and exposure, scored on a scale of 0 (lowest risk) to 1 (highest risk) with the lowest and highest hazard, exposure and vulnerability (Carrão et al., 2016).