Figure 4.12
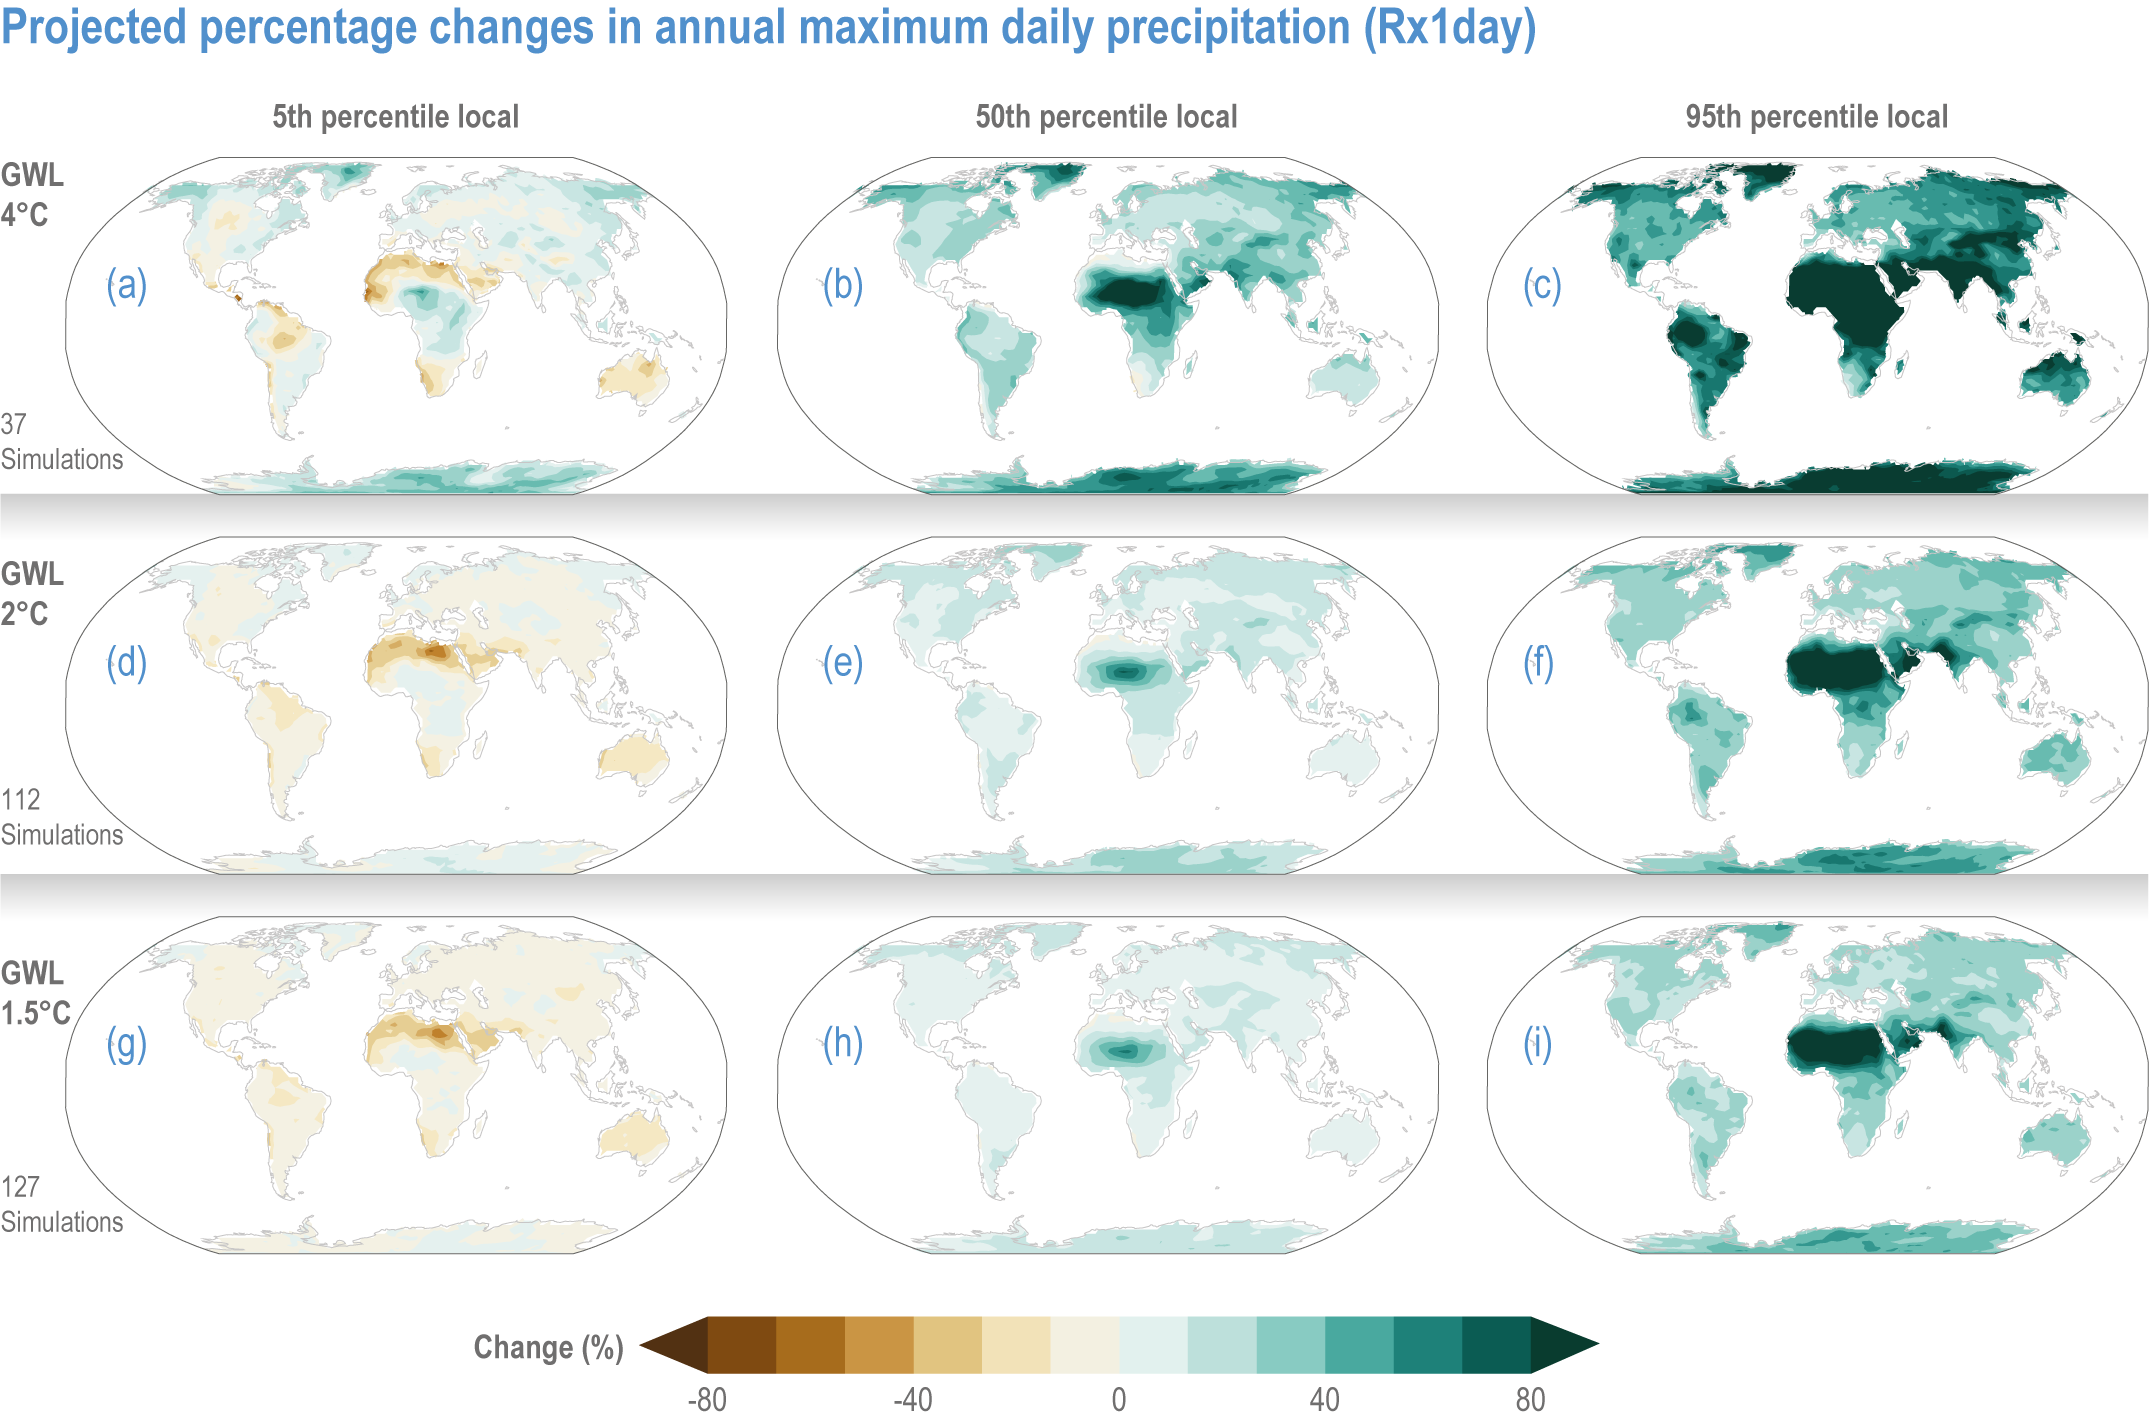
Figure caption
Figure 4.12 | Projected percentage changes in annual maximum daily precipitation (Rx1day) averaged over 20 years centred at the time of first passing (a–c) 4°C, (d–f) 2°C and (g–i) 1.5°C global warming levels (GWLs) relative to 1851–1900. Results are based on simulations from the CMIP6 multi-model ensemble under the SSP1-1.9, SSP1-2.6, SSP2-4.5, SSP3-7.0 and SSP5-8.5 scenarios. Uncertainties in the projections are quantified with the (a, d, g) 5th, (b, e, h) 50th and (c, f, i) 95th percentile local values from the ensemble at each GWL. Note that these are uncertainties at the individual point and are not spatially coherent, that is, they do not represent plausible global patterns of change. The 50th percentile maps (b, e, h) present the same data over land as Figure 11.16 of Seneviratne et al. (2021). The numbers on the left indicate the number of simulations included at each warming level, including multiple realisations from some models with varying initial conditions, depending on data availability. Results for the 1.5°C GWL include 37 unique models. Fewer models and realisations are available for the 2°C and 4°C GWLs, as fewer scenarios and/or models reach those warming levels. For individual models, the global patterns of changes are very similar across scenarios, and any differences between scenarios are smaller than the ensemble uncertainty for an individual scenario. The CMIP6 projections of changes in mean and extreme precipitation are discussed in more detail by WGI (Doblas-Reyes et al., 2021; Seneviratne et al., 2021).