Back chapter figures
Figure 4.14
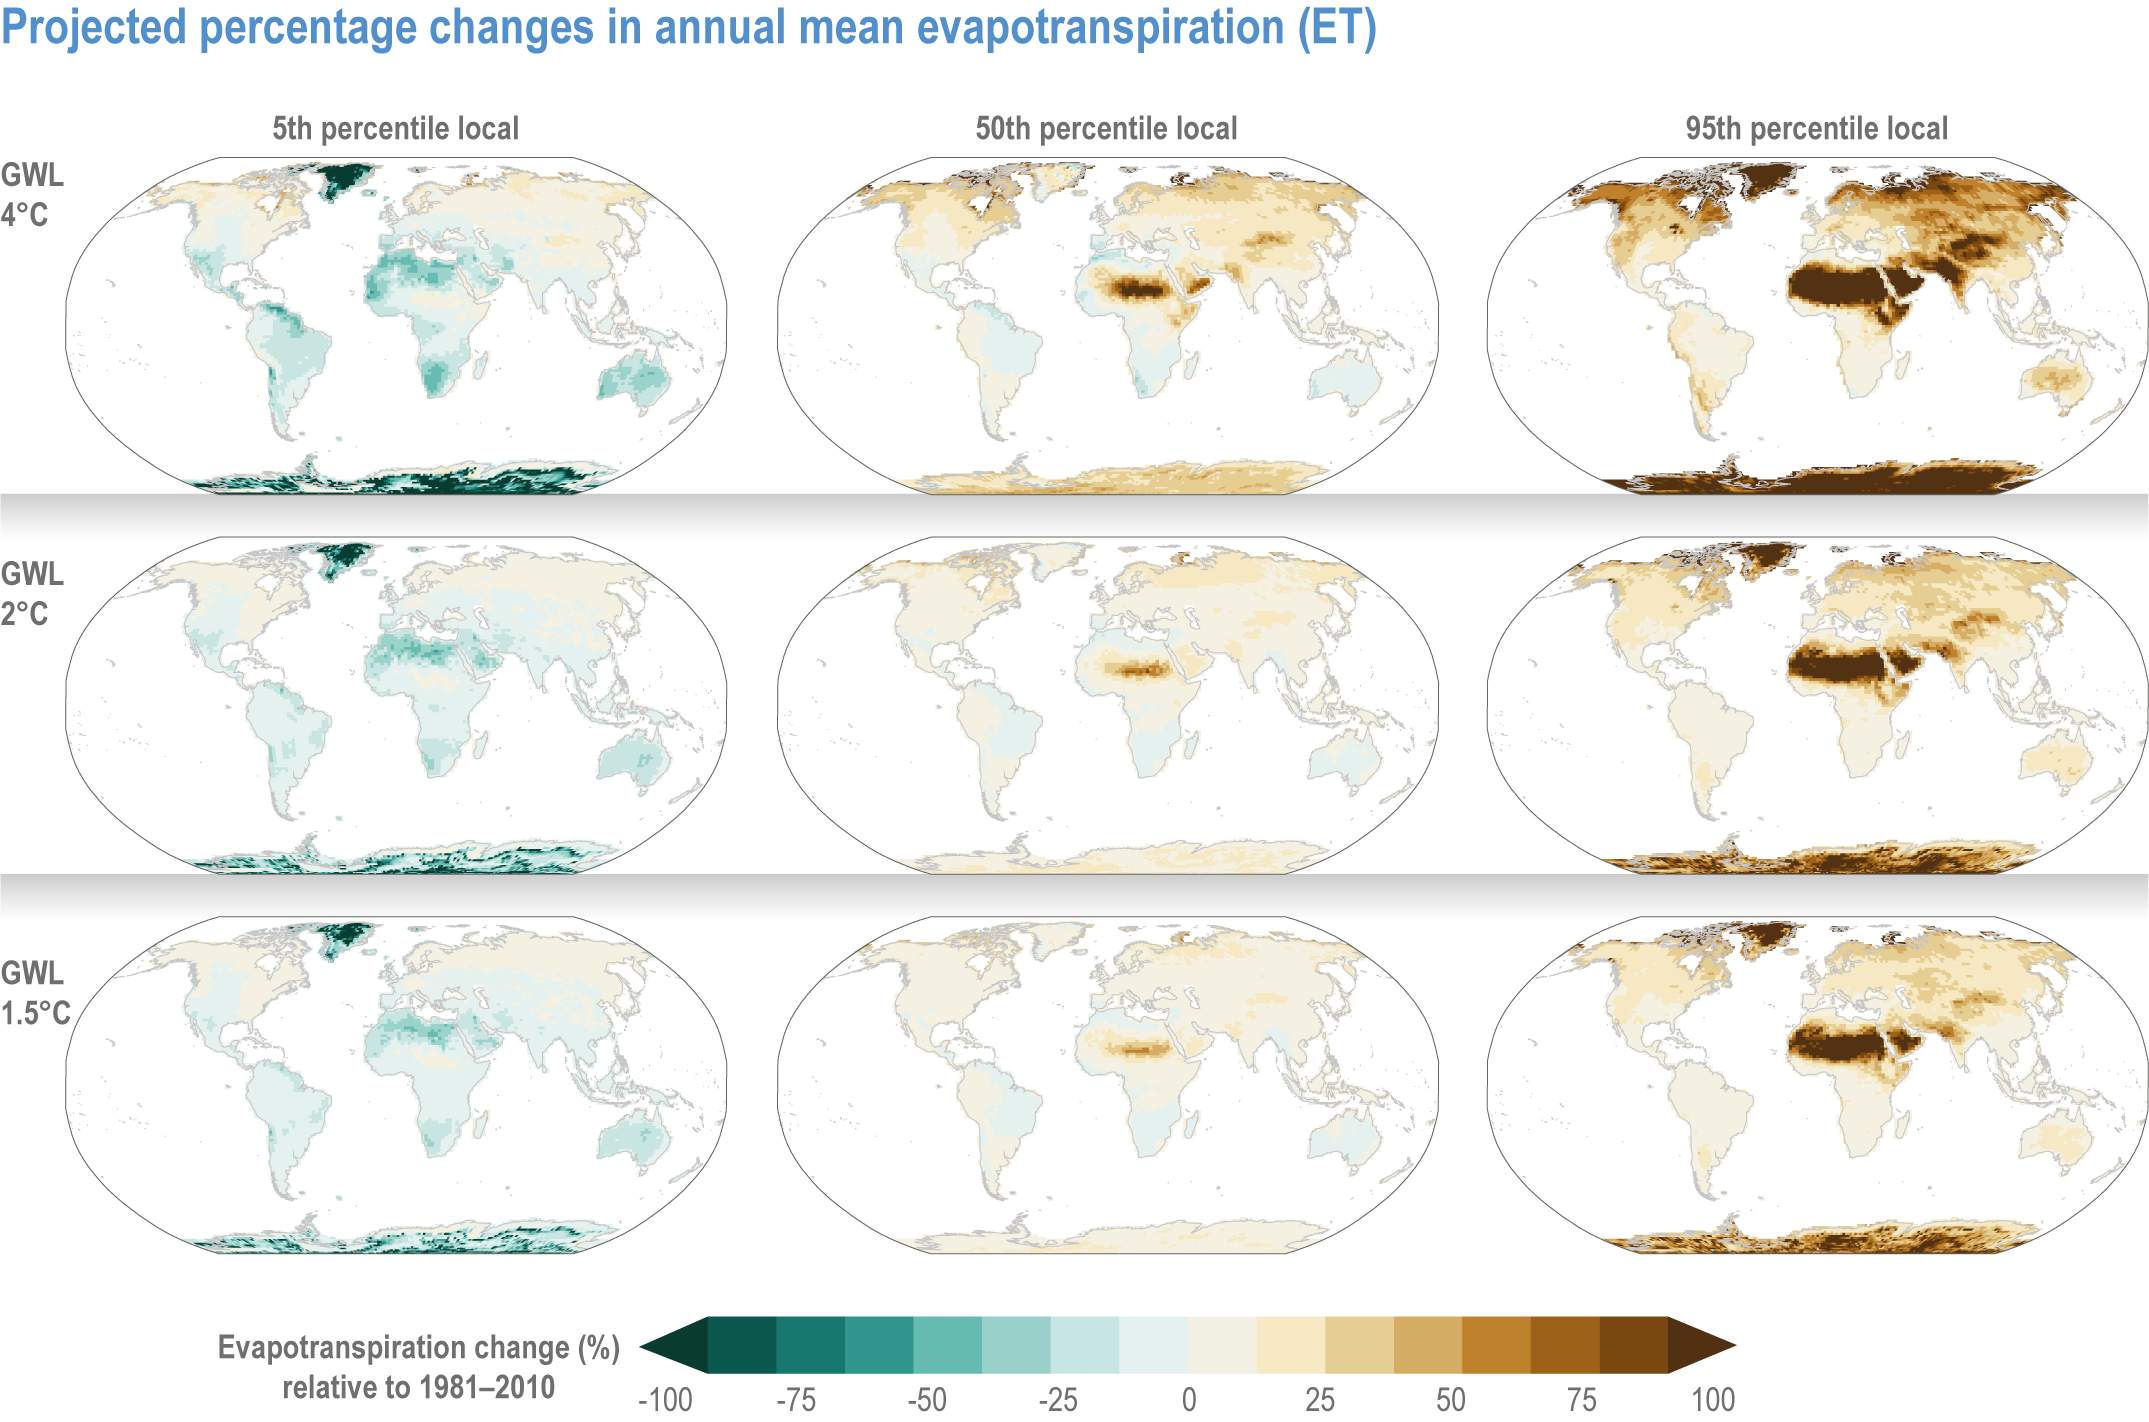
Figure caption
Figure 4.14 | Projected percentage changes in annual mean ET at global warming levels (GWLs) of 4°C (top), 2°C (middle) and 1.5°C (bottom) for the CMIP6 multi-model ensemble of GCMs driven by SSP5-8.5 concentrations. The distribution of outcomes is shown at local scales with the 5th, 50th and 95th percentile ET changes in individual grid boxes. Note that these are uncertainties at the individual point and are not spatially coherent, that is, they do not represent plausible global patterns of change. Results for 1.5°C, 2°C and 4°C global warming are defined as 20-year means relative to 1850–1900 and use 40, 40 and 31 ensemble members, respectively, due to some members not reaching 4°C global warming.