Figure 4.16
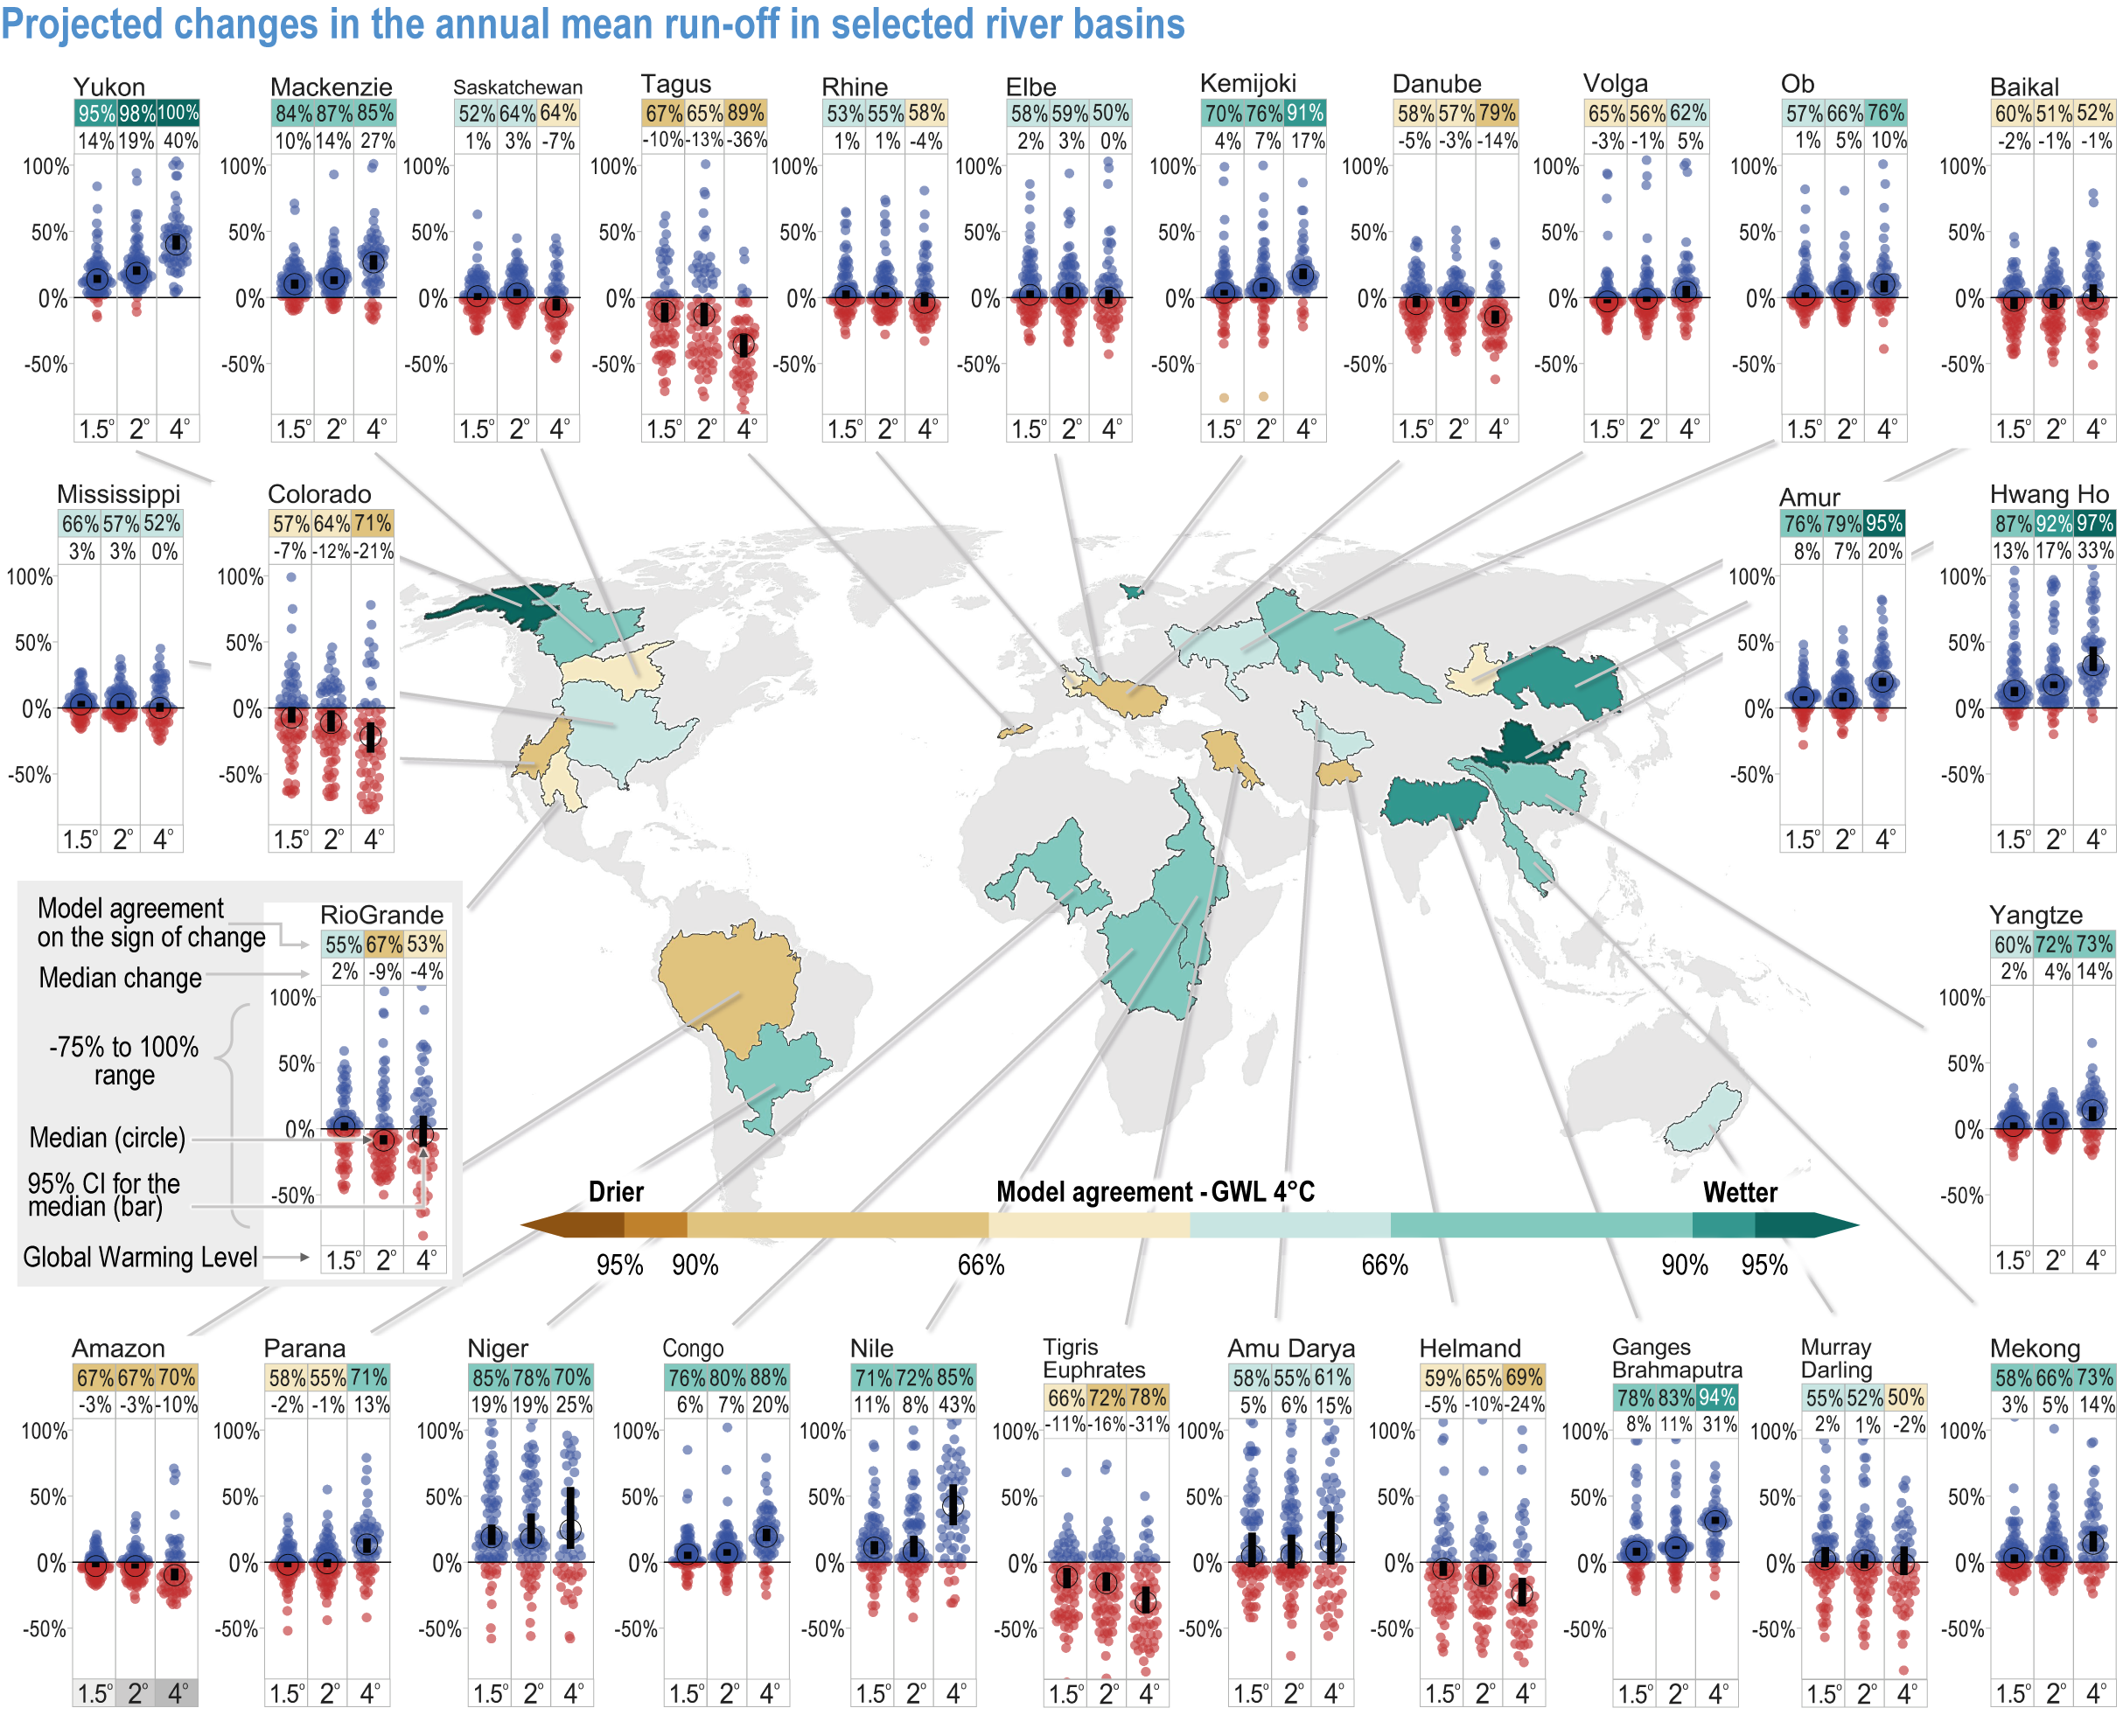
Figure caption
Figure 4.16 | Projected changes in the annual mean runoff in selected river basins at global warming levels (GWLs) of 1.5°C, 2°C and 4°C in a combined ensemble. For each named basin, the sinaplot dots show individual model outcomes for percentage increased flows (blue) and decreased flows (red) at each GWL. Black circles show the ensemble median, and black bars show the 95% confidence range in the median. See inset with the Rio Grande sinaplot for additional guidance on interpretation. In the map, the colours in the basins show the percentage model agreement on the sign of the projected change in streamflow at the 4°C GWL. The combined ensemble is comprised of four multi-model ensembles: the CMIP5 multi-model ensemble of GCMs driven with RCP8.5; the CMIP6 multi-model ensemble of GCMs driven with SSP5-8.5; varying combinations of hydrological models with five GCMs in the Inter-Sectoral Impacts Model Intercomparison Project (ISIMIP); and the JULES land ecosystems and hydrology model driven by GCMs from the HELIX study (Betts et al., 2018; Koutroulis et al., 2019). In CMIP5 and CMIP6, the projected runoff changes are directly from the GCM land surface schemes without bias correction. In ISIMIP and HELIX, bias-corrected climate model outputs were used to drive the hydrology models. A comparison of the projected changes at the 4°C GWL for the four individual ensembles is shown in Figure Cross-Chapter Box CLIMATE.1 in Chapter 1.