Figure 4.17
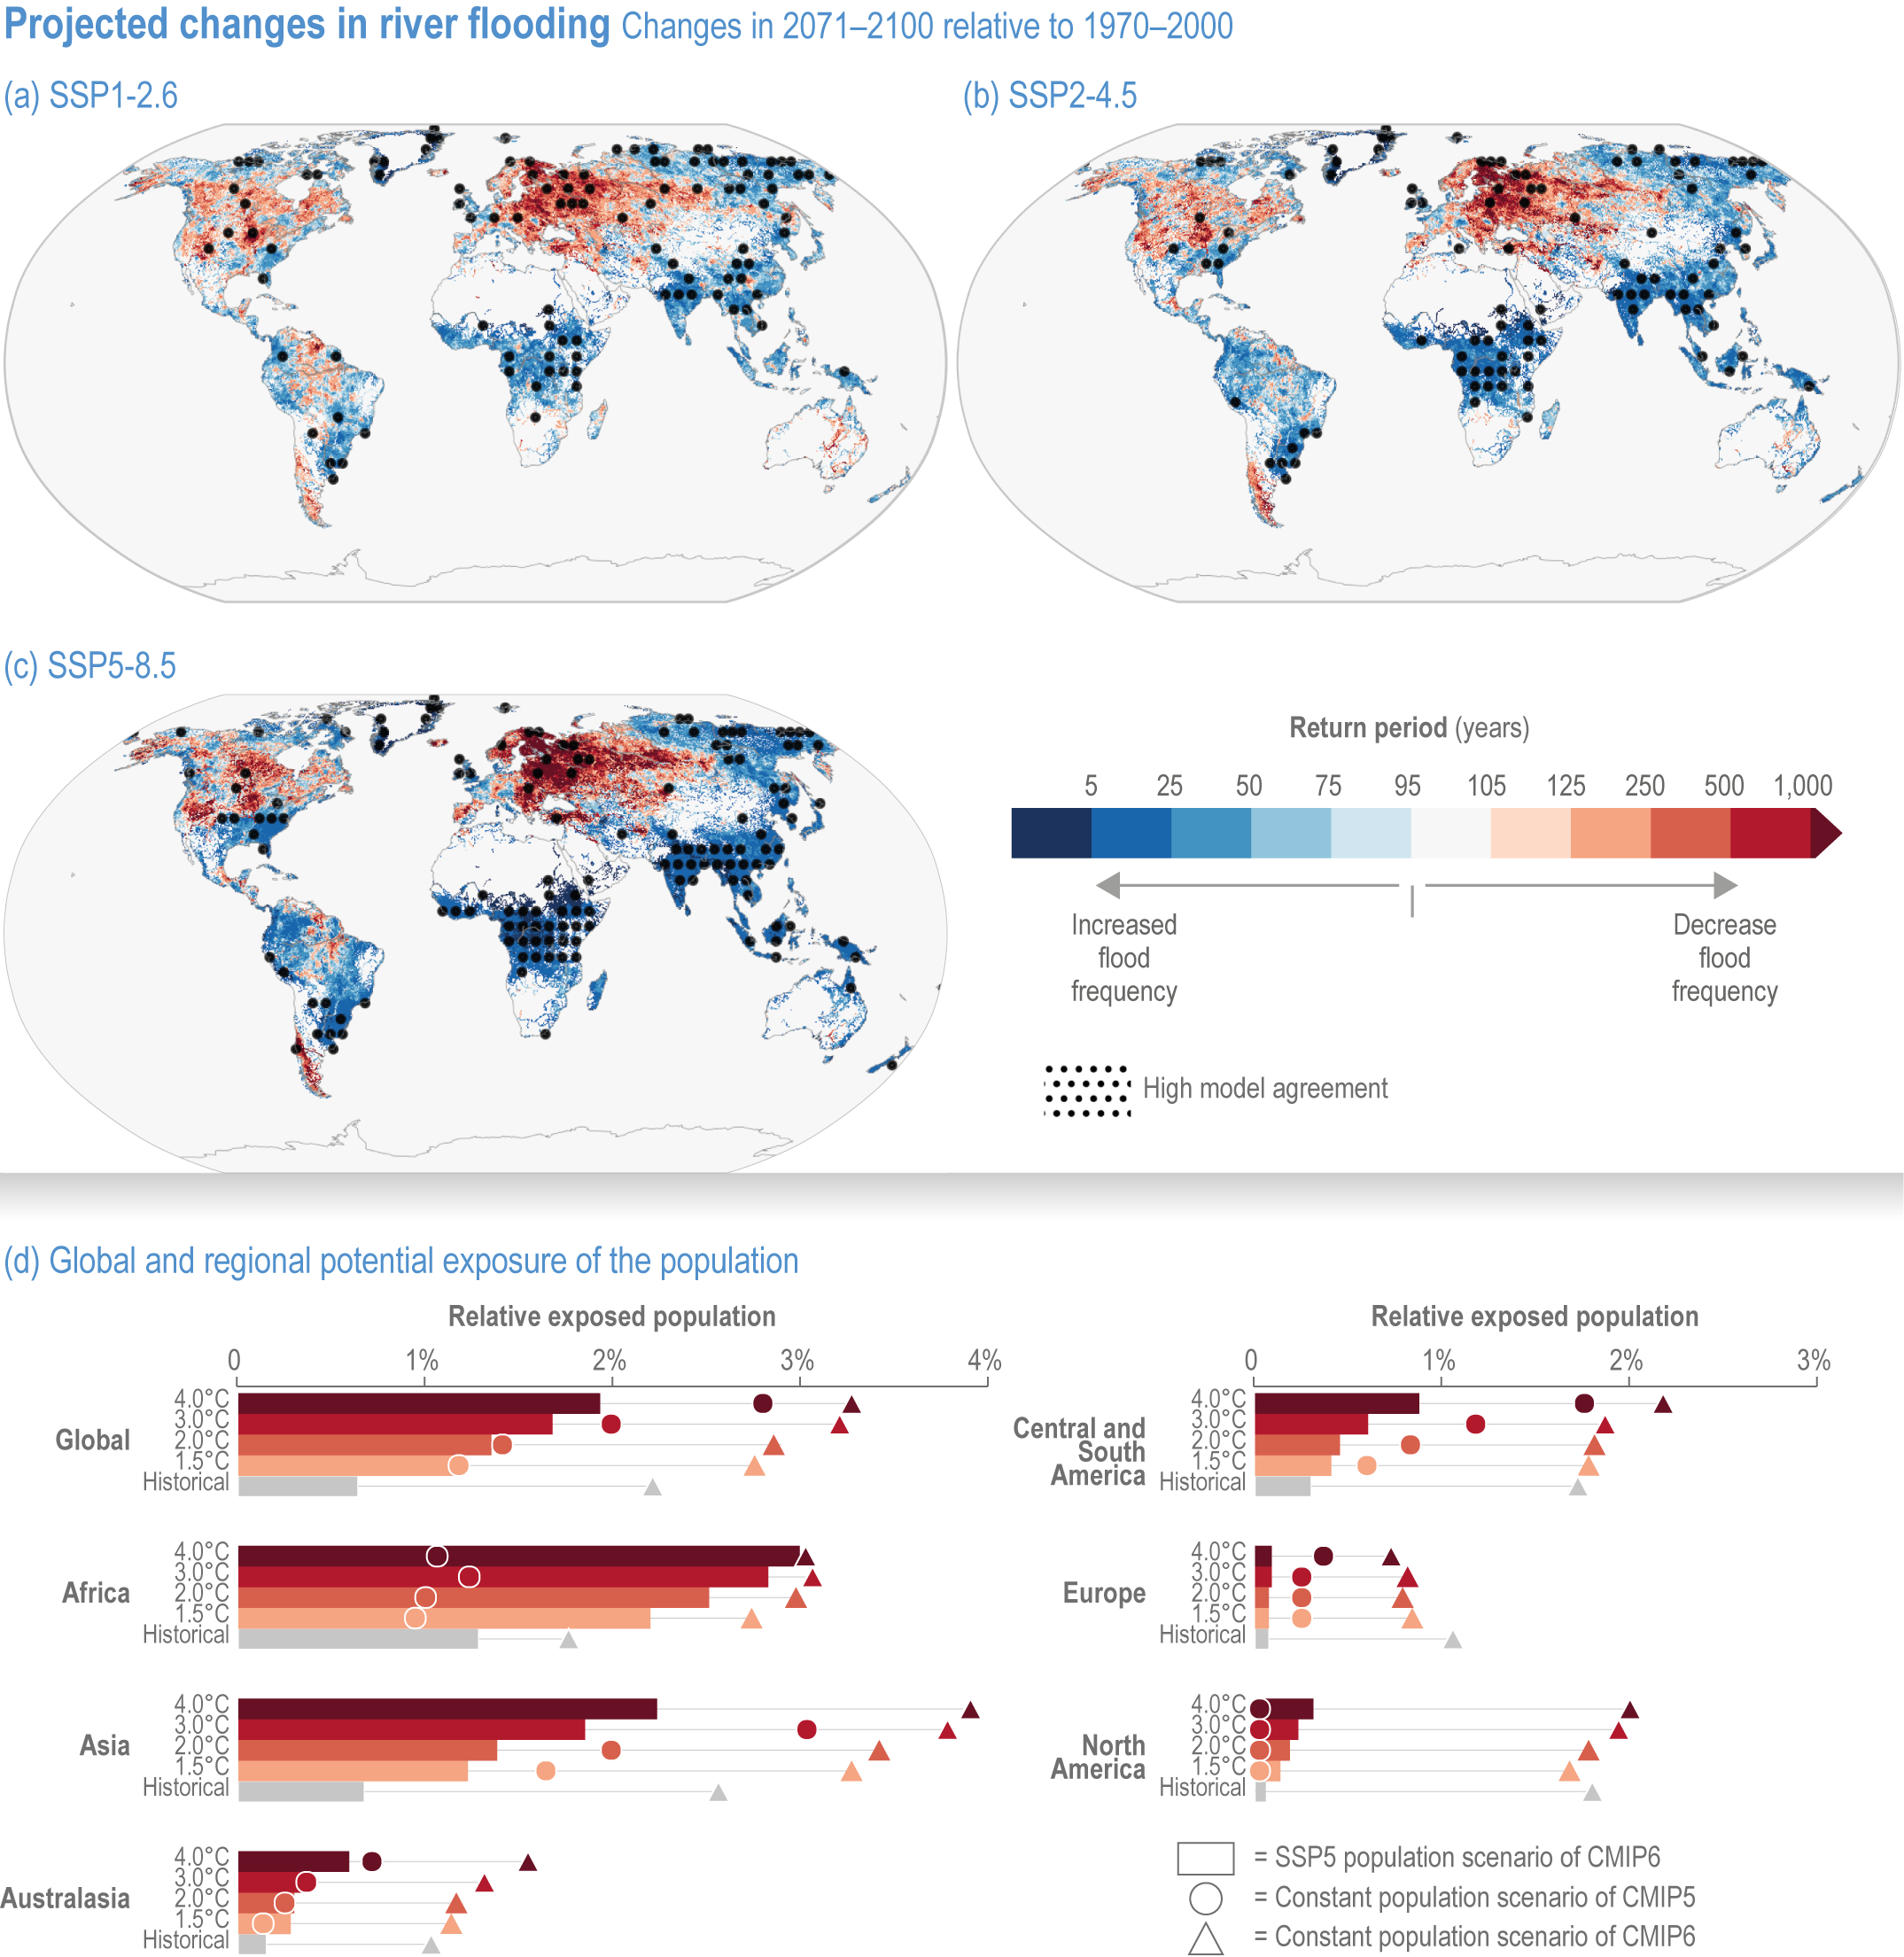
Figure caption
Figure 4.17 | Multi-model median return period (years) in the 2080s for the 20th-century 100-year river flood, based on a global river and inundation model, CaMa-Flood, driven by runoff output of nine CMIP6 Models in the SSP1-2. 6 (a), SSP2-4.5 (b) and SSP5-8.5 (c) scenario respectively. All changes are estimated in 2071–2100 relative to 1970-–2000. A dot indicates regions with high model consistency (more than seven models out of nine show the same direction of change).
(d) Global or regional potential exposure (% to the total population affected by flooding) under different global warming levels with a constant population scenario and climate of CMIP5-HELIX (circle, Alfieri et al., 2017) and CMIP6 (triangle, Hirabayashi et al., 2021b), and with the population scenario of SSP5 and climate of CMIP6 (bar chart, Hirabayashi et al., 2021b). Inundation is calculated when the magnitude of flood exceeds current flood protection (Scussolini et al., 2016). Note that number of GCMs used to calculate global warming level (GWL) 4.0 is less than that for other GWLs, as the global mean temperature change of some GCMs did not exceed 4°C.