Figure 4.18
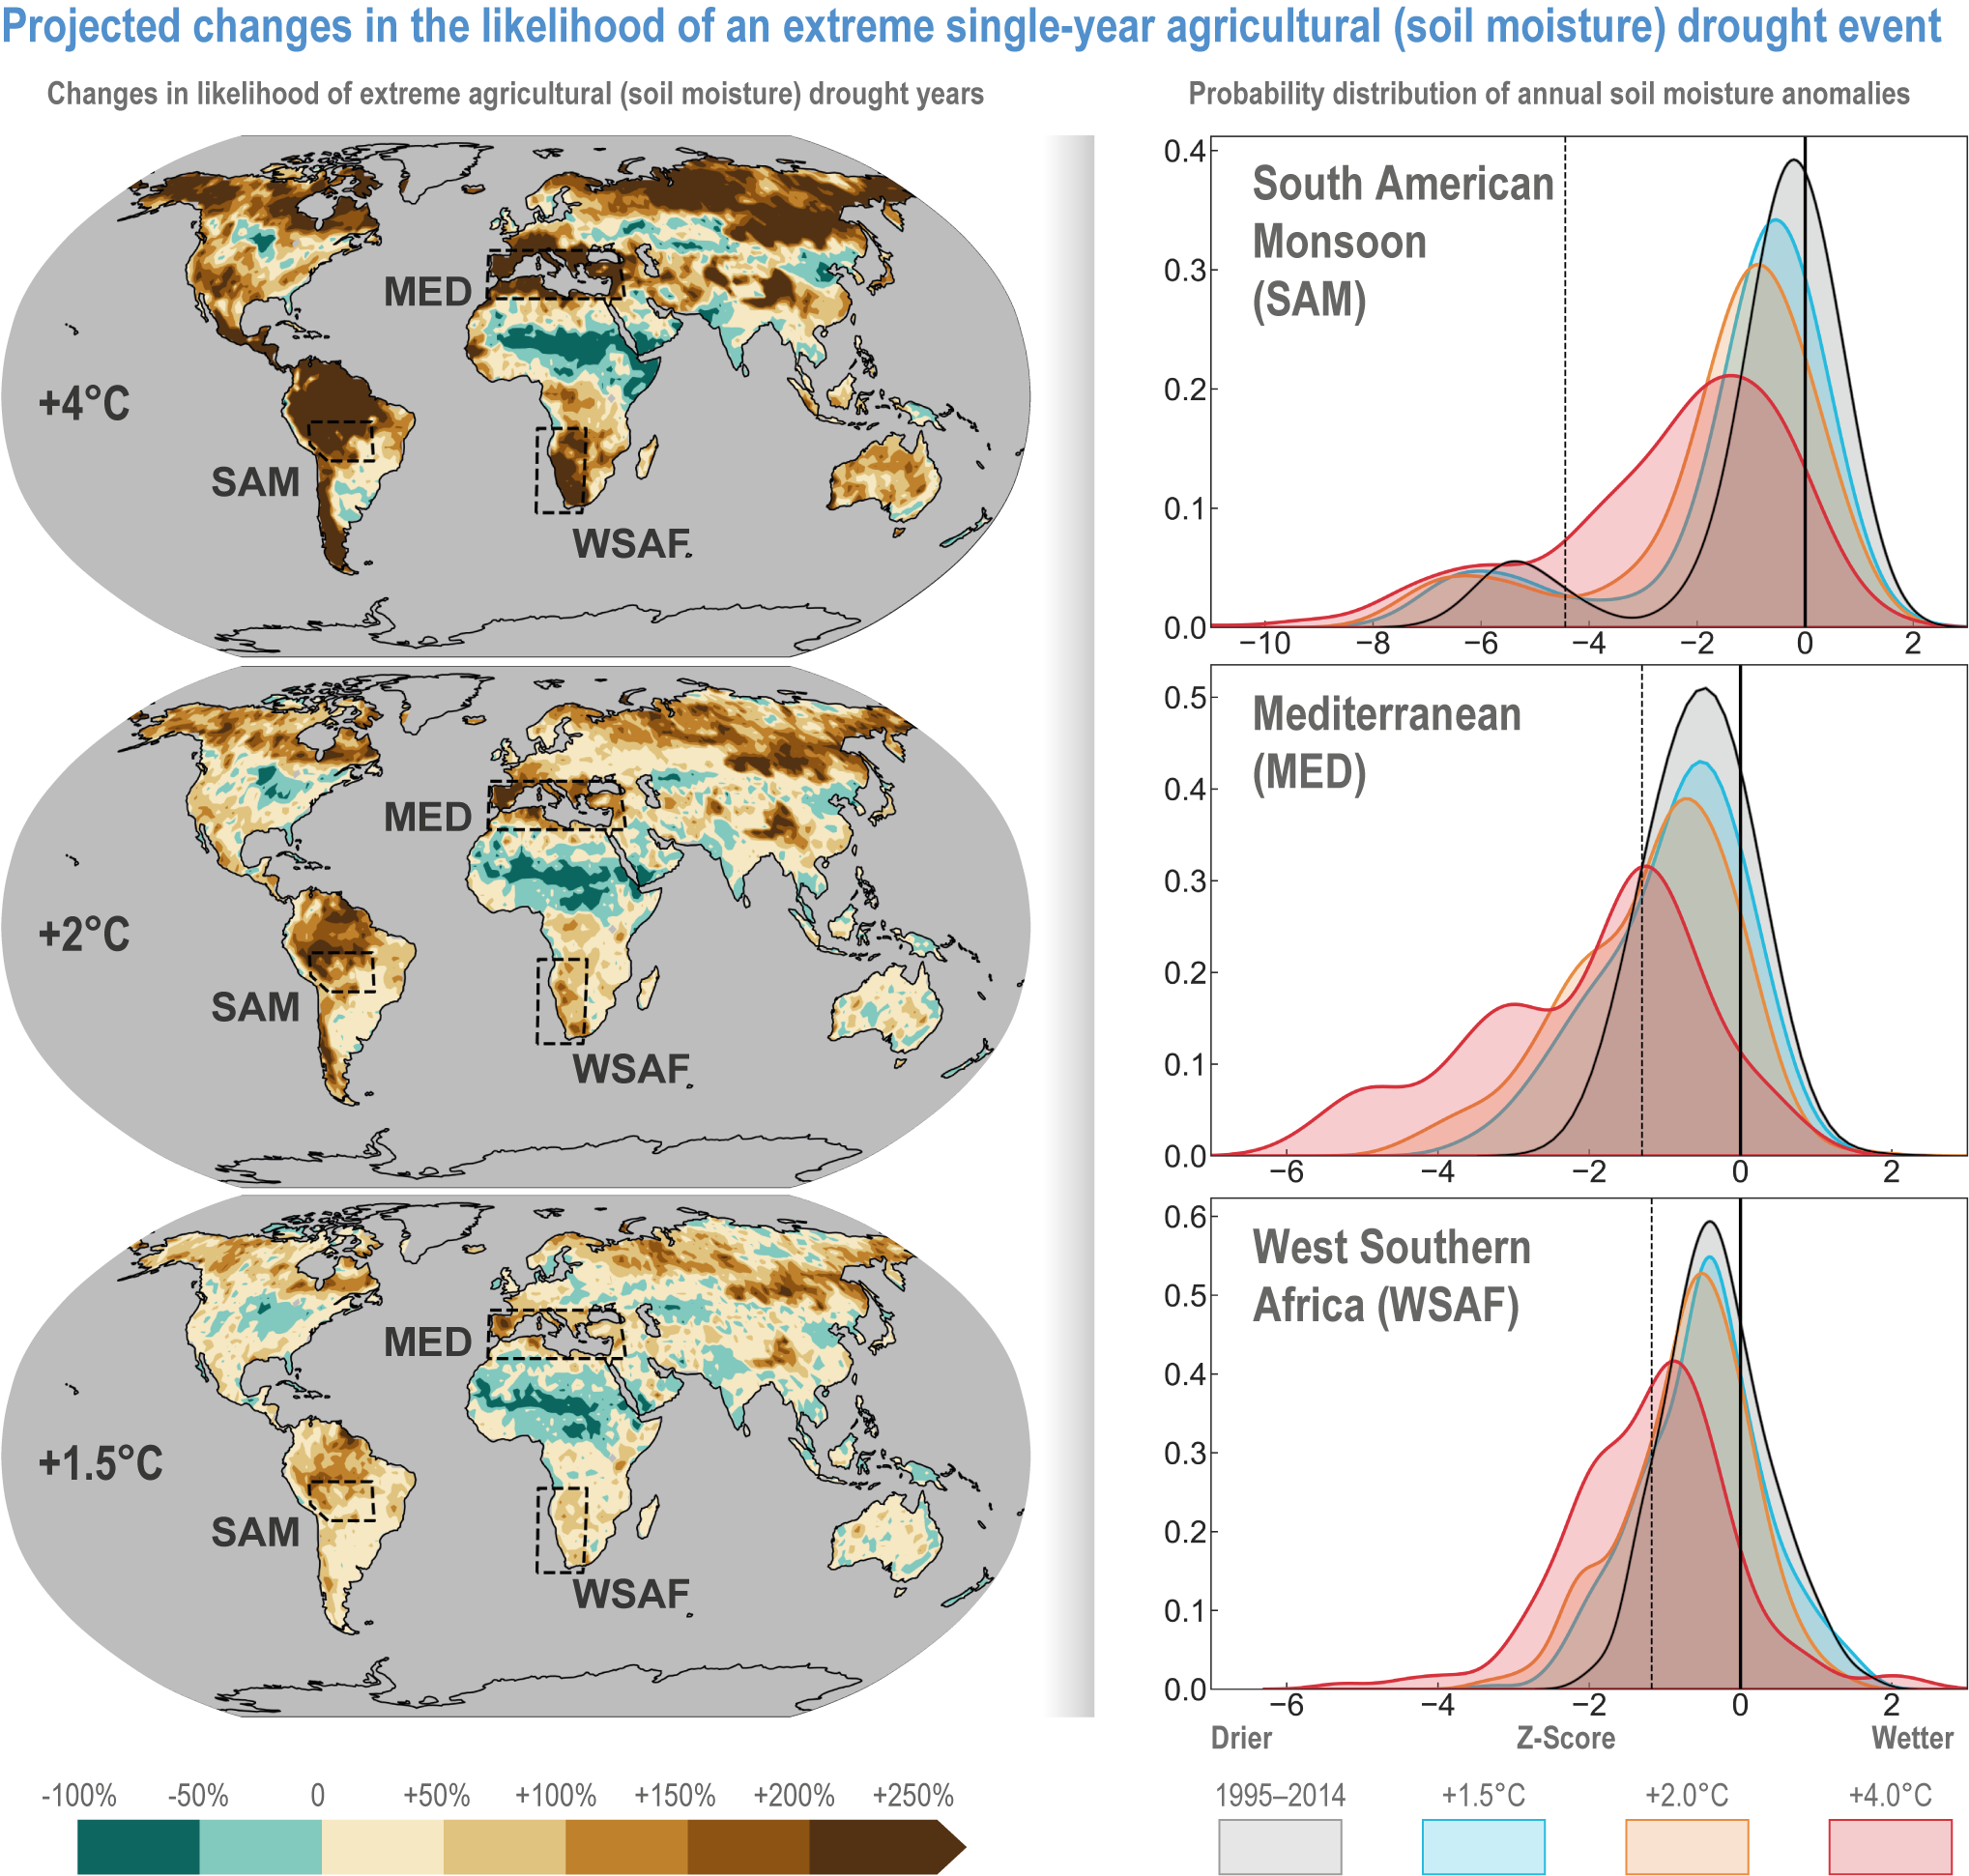
Figure caption
Figure 4.18 | Projected changes in the likelihood of an extreme single-year agricultural (soil moisture) drought event, with extreme drought defined as the driest 10% of years from 1995 to 2014, using total soil moisture projections pooled from the CMIP6 ensemble following Cook et al. (2020a). All ensemble members are treated as equally likely potential outcomes, and likelihoods are calculated using the whole ensemble. Left: Percentage change in the likelihood of extreme drought at GWLs of 4°C (top), 2°C (middle) and 1.5°C (bottom), with ‘extreme drought’ defined locally as the 10th percentile in individual grid boxes. Right: probability distribution functions of regional mean soil moisture anomalies for the climatic regions Mediterranean (MED), South American Monsoon (SAM) and West Southern Africa (WSAF) (Iturbide et al., 2020), at 1.5°C, 2°C and 4°C GWLs. The solid vertical line shows the baseline, that is, the 50th percentile in 1995–2014. The dashed vertical line shows the 10th percentile for 1995–2014, defining ‘extreme drought’ at the regional scale. Projections used the SSP5-8.5 scenario to maximise the number of ensemble members at higher GWLs, but global patterns of change are very similar for all scenarios (Cook et al., 2020a), and for any given GWL, similar results can be expected with other scenarios (Seneviratne et al., 2021).