Back chapter figures
Figure 4.19
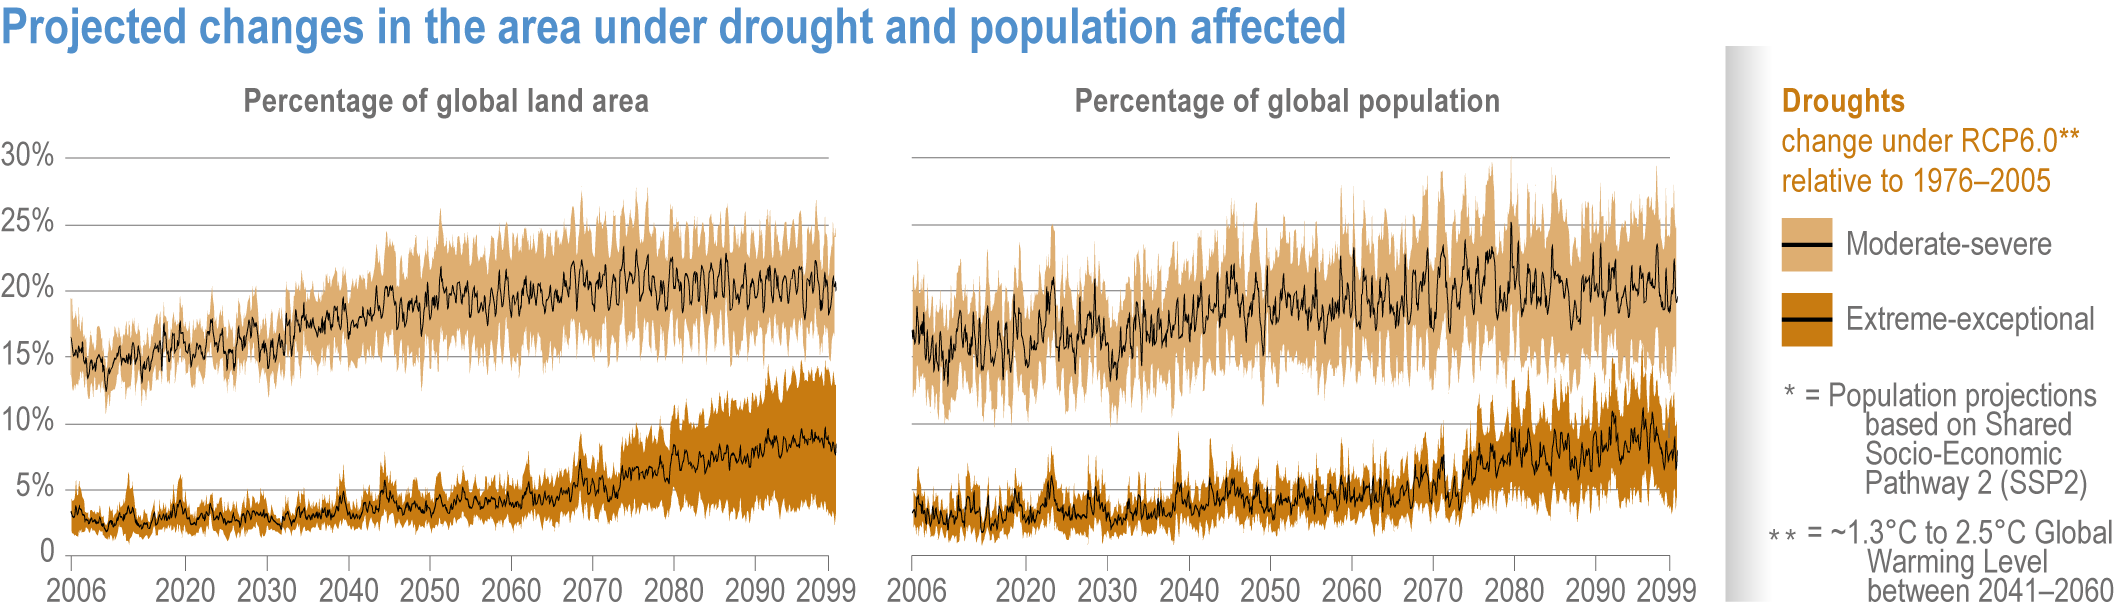
Figure caption
Figure 4.19 | Projected changes in the area under drought and population affected, defined with changes in the Terrestrial Water Storage–Drought Severity Index (TWS-DSI) projected with seven terrestrial hydrology models driven by four CMIP5 climate models using RCP6. 0.
(a) Fractional global land area under moderate-to-severe drought (top), defined as −0.8 ≤ TWS-DSI < −1.6, and extreme-to-exceptional drought (bottom), defined as TWS-DSI < −1.6.
(b) Fraction of global population exposed to moderate-to-severe (top) and extreme-to-exceptional (bottom) drought, using the SSP2 population projection. Dark lines show the ensemble means; shaded areas indicate uncertainty as ± 1 standard deviation. Reproduced from Pokhrel et al. (2021).