Figure 4.20
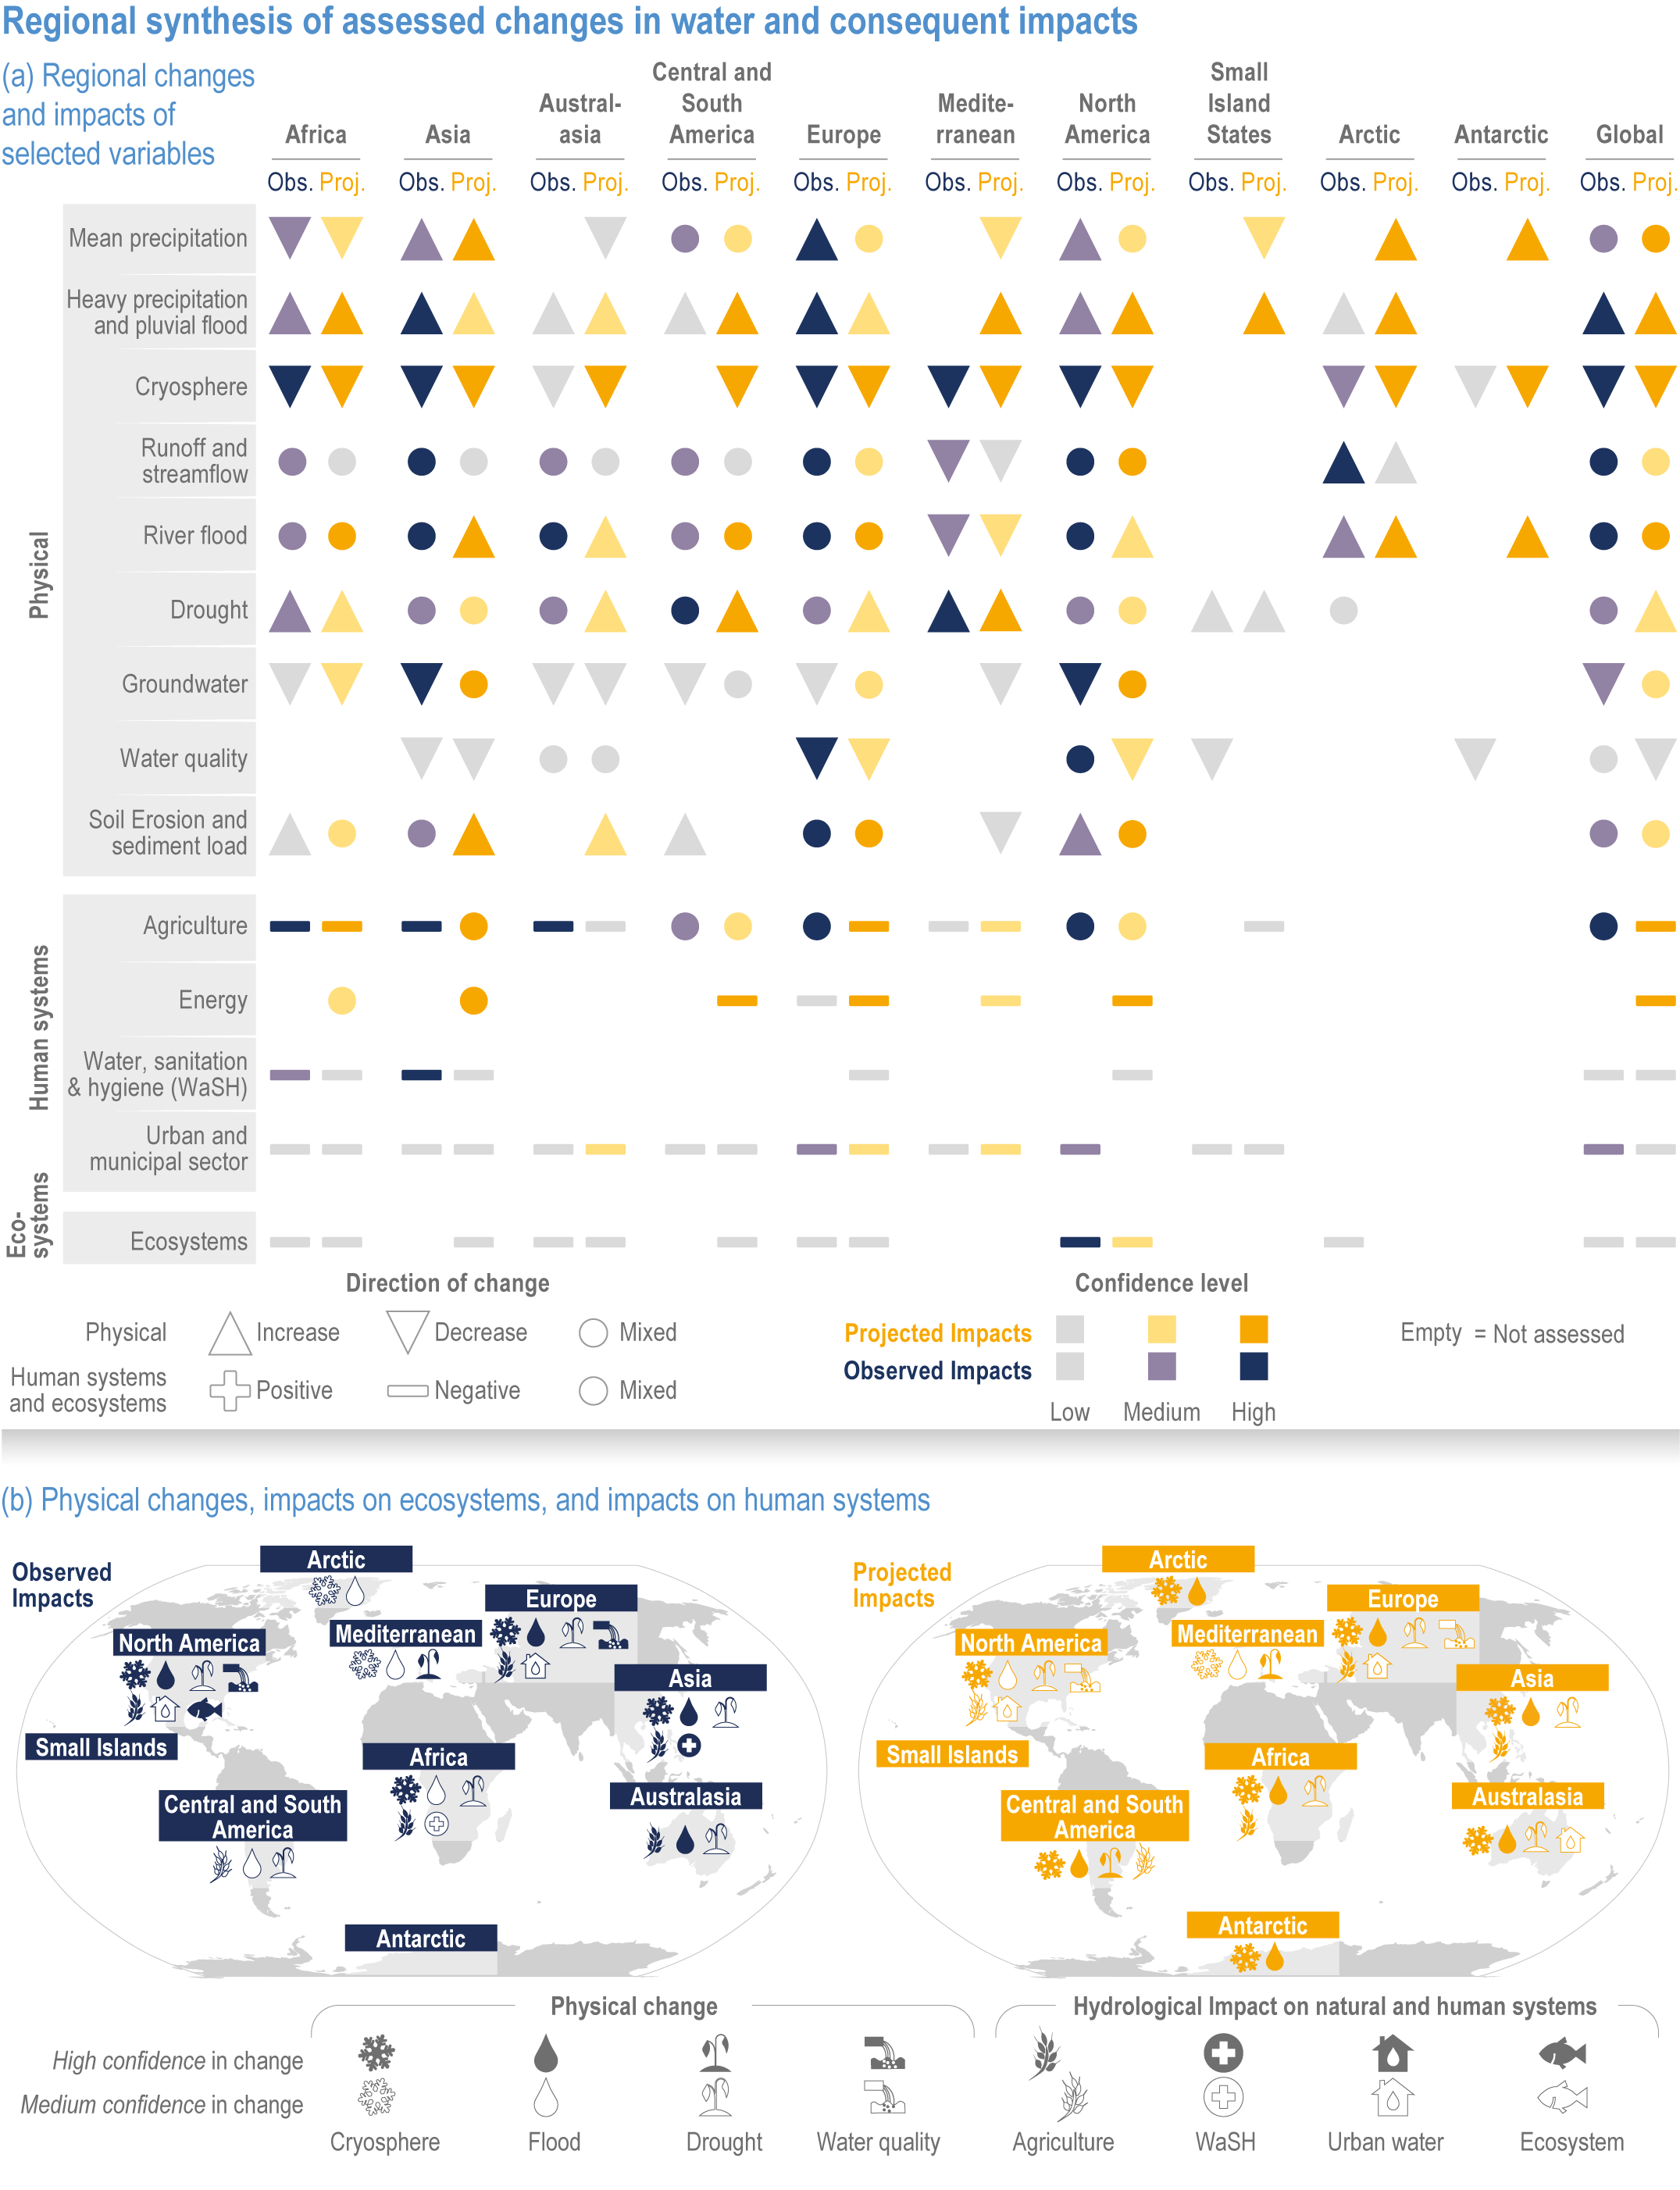
Figure caption
Figure 4.20 | Regional synthesis of changes in water and consequent impacts assessed in this chapter.
(a) Regional changes and impacts of selected variables. Confidence levels higher than medium are shown.
(b) Assessment result of all variables. For each region, physical changes, impacts on ecosystems and impacts on human systems are shown. For physical changes, upward/downward triangles refer to an increase/decrease, respectively, in the amount or frequency of the measured variable, and the level of confidence refers to confidence that the change has occurred. For impacts on ecosystems and human systems, plus or minus marks depict whether an observed impact of hydrological change is positive (beneficial) or negative (adverse), respectively, to the given system, and the level of confidence refers to confidence in attributing an impact on that system to a climate-induced hydrological change. The hydrological impact may be different to the overall change in the system; for example, over much of the world, crop yields have increased overall, largely for non-climatic reasons, but in some areas, hydrological impacts of climate change are countering this. Circles indicate that within that region, both increase and decrease of physical changes are found, but are not necessarily equal; the same holds for cells showing ‘both’ assessed impacts. Cells assigned ‘n.a.’ indicates variables not assessed due to limited evidences. Decrease (increase) in water quality refers to adverse (positive) change in quality. Agriculture refers to impacts on crop production. Note: Energy refers to impacts on hydro and thermoelectric power generation. Ecosystems refers to impacts on freshwater ecosystem.