Back chapter figures
Figure 4.24
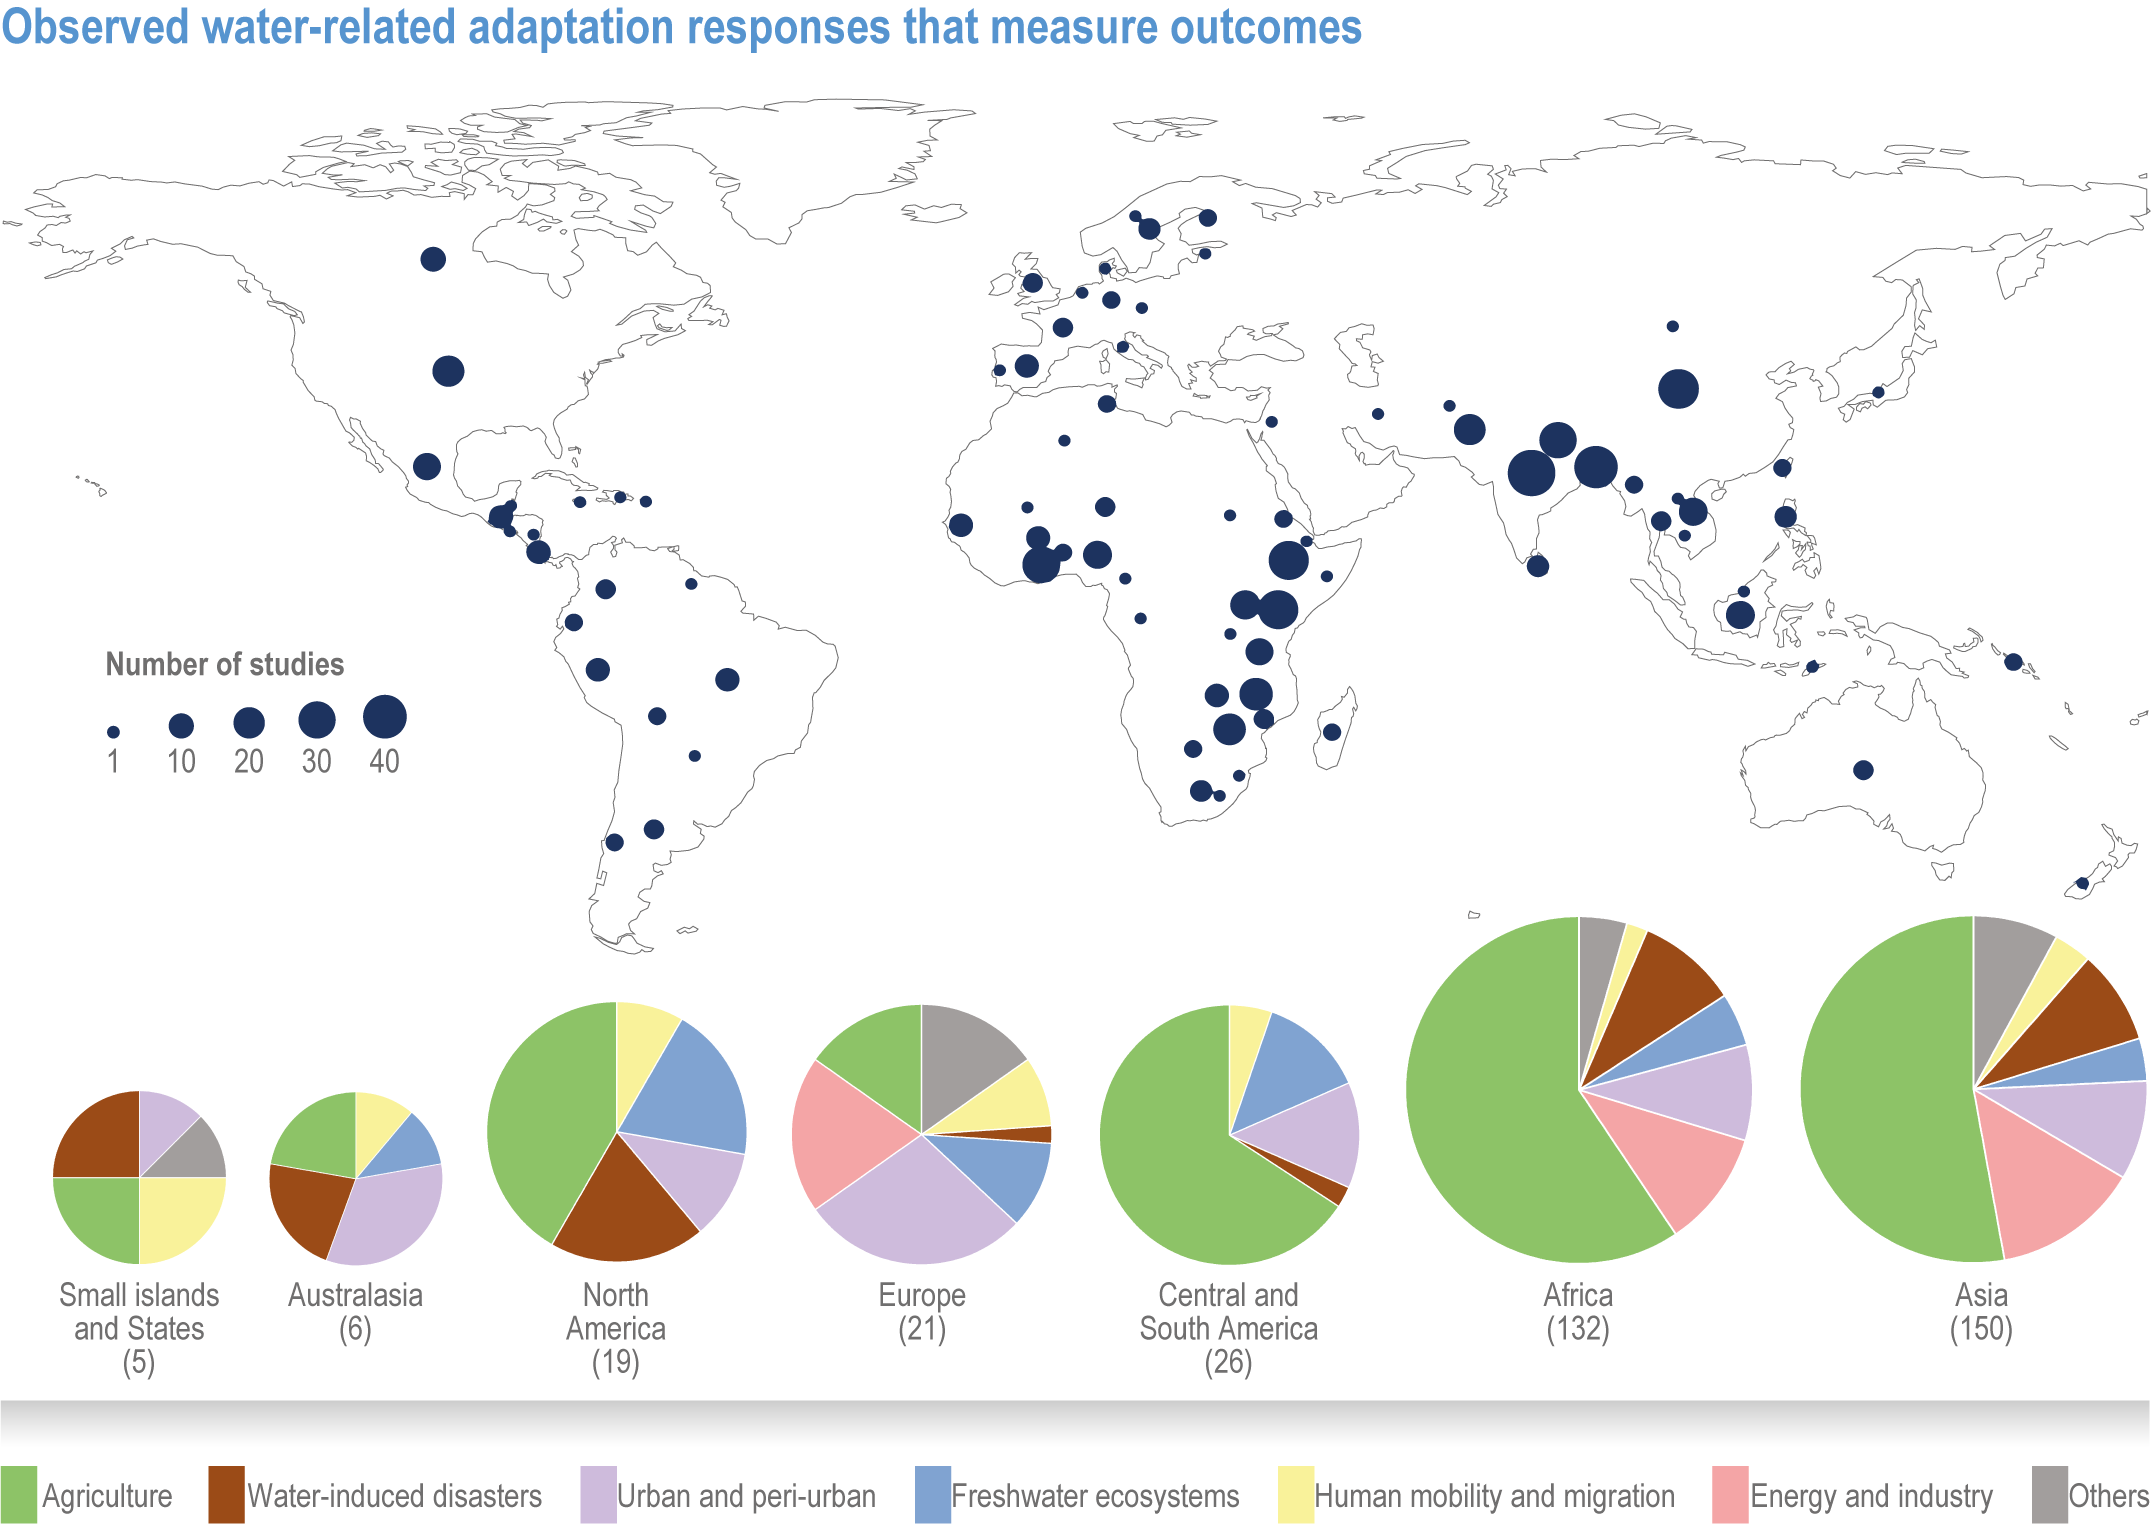
Figure caption
Figure 4.24 | Location of case studies on water-related adaptation which measure adaptation outcomes (n = 359) and their sectoral distribution across all regions. Circles denote the number of case studies in a particular location in the continent. The pie chart shows the sectors in which adaptation is taking place. The sectors correspond to water use sectors described in Sections 4.3, 4.5 and 4.6 of this chapter.