Figure 4.27
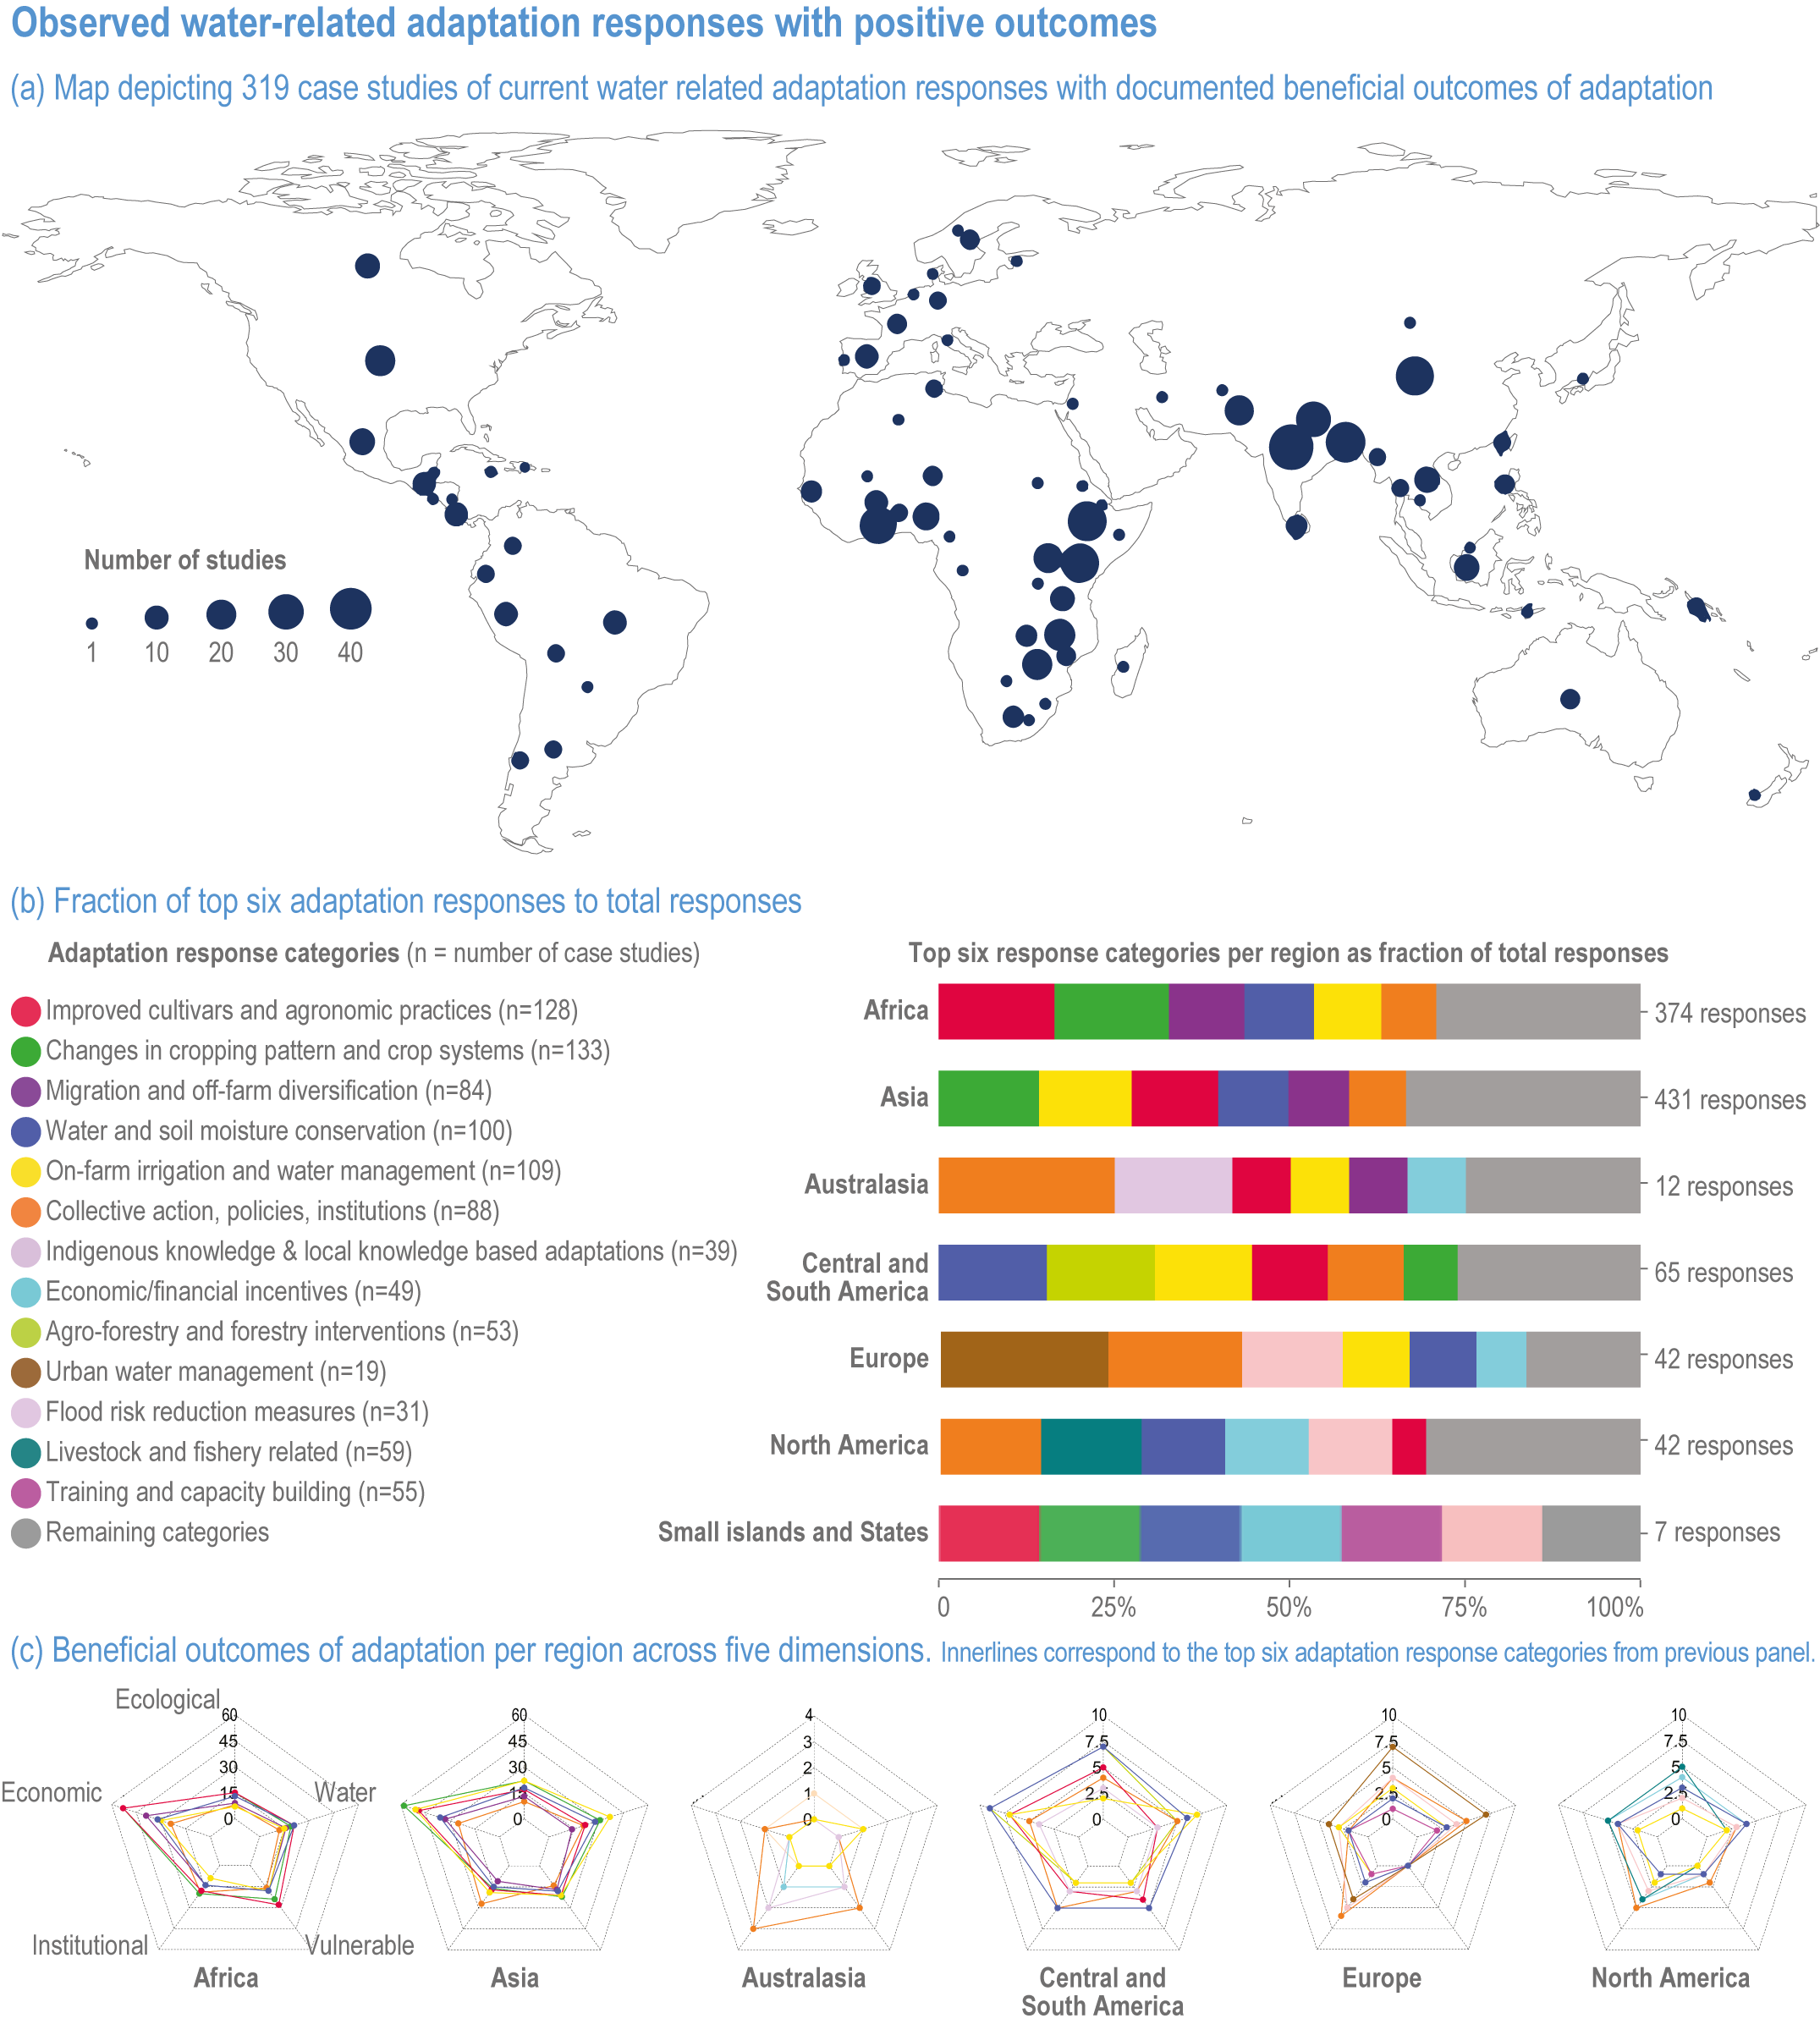
Figure caption
Figure 4.27 | Top panel: location of case studies of water-related adaptation responses (996 data points from 319 studies). In these 996 data points, at least one positive outcome was recorded in one of the five outcome indicators. These outcome indicators are economic/financial, outcomes for vulnerable people, ecological/environmental, water-related, and sociocultural and institutional. Middle panel: the top six documented adaptation options per region as a fraction of the total of reported studies, with grey bars containing the share of all other adaptation responses. In most instances, the top six adaptation categories include nearly 3/4 of the studies. Bottom panel: The spider diagrams show the number of studies reporting beneficial outcomes for one or more dimensions for the top six adaptation options identified in each region. Due to a small number of studies in small island states, a spider diagram was not generated for the small island states.