Figure 4.29
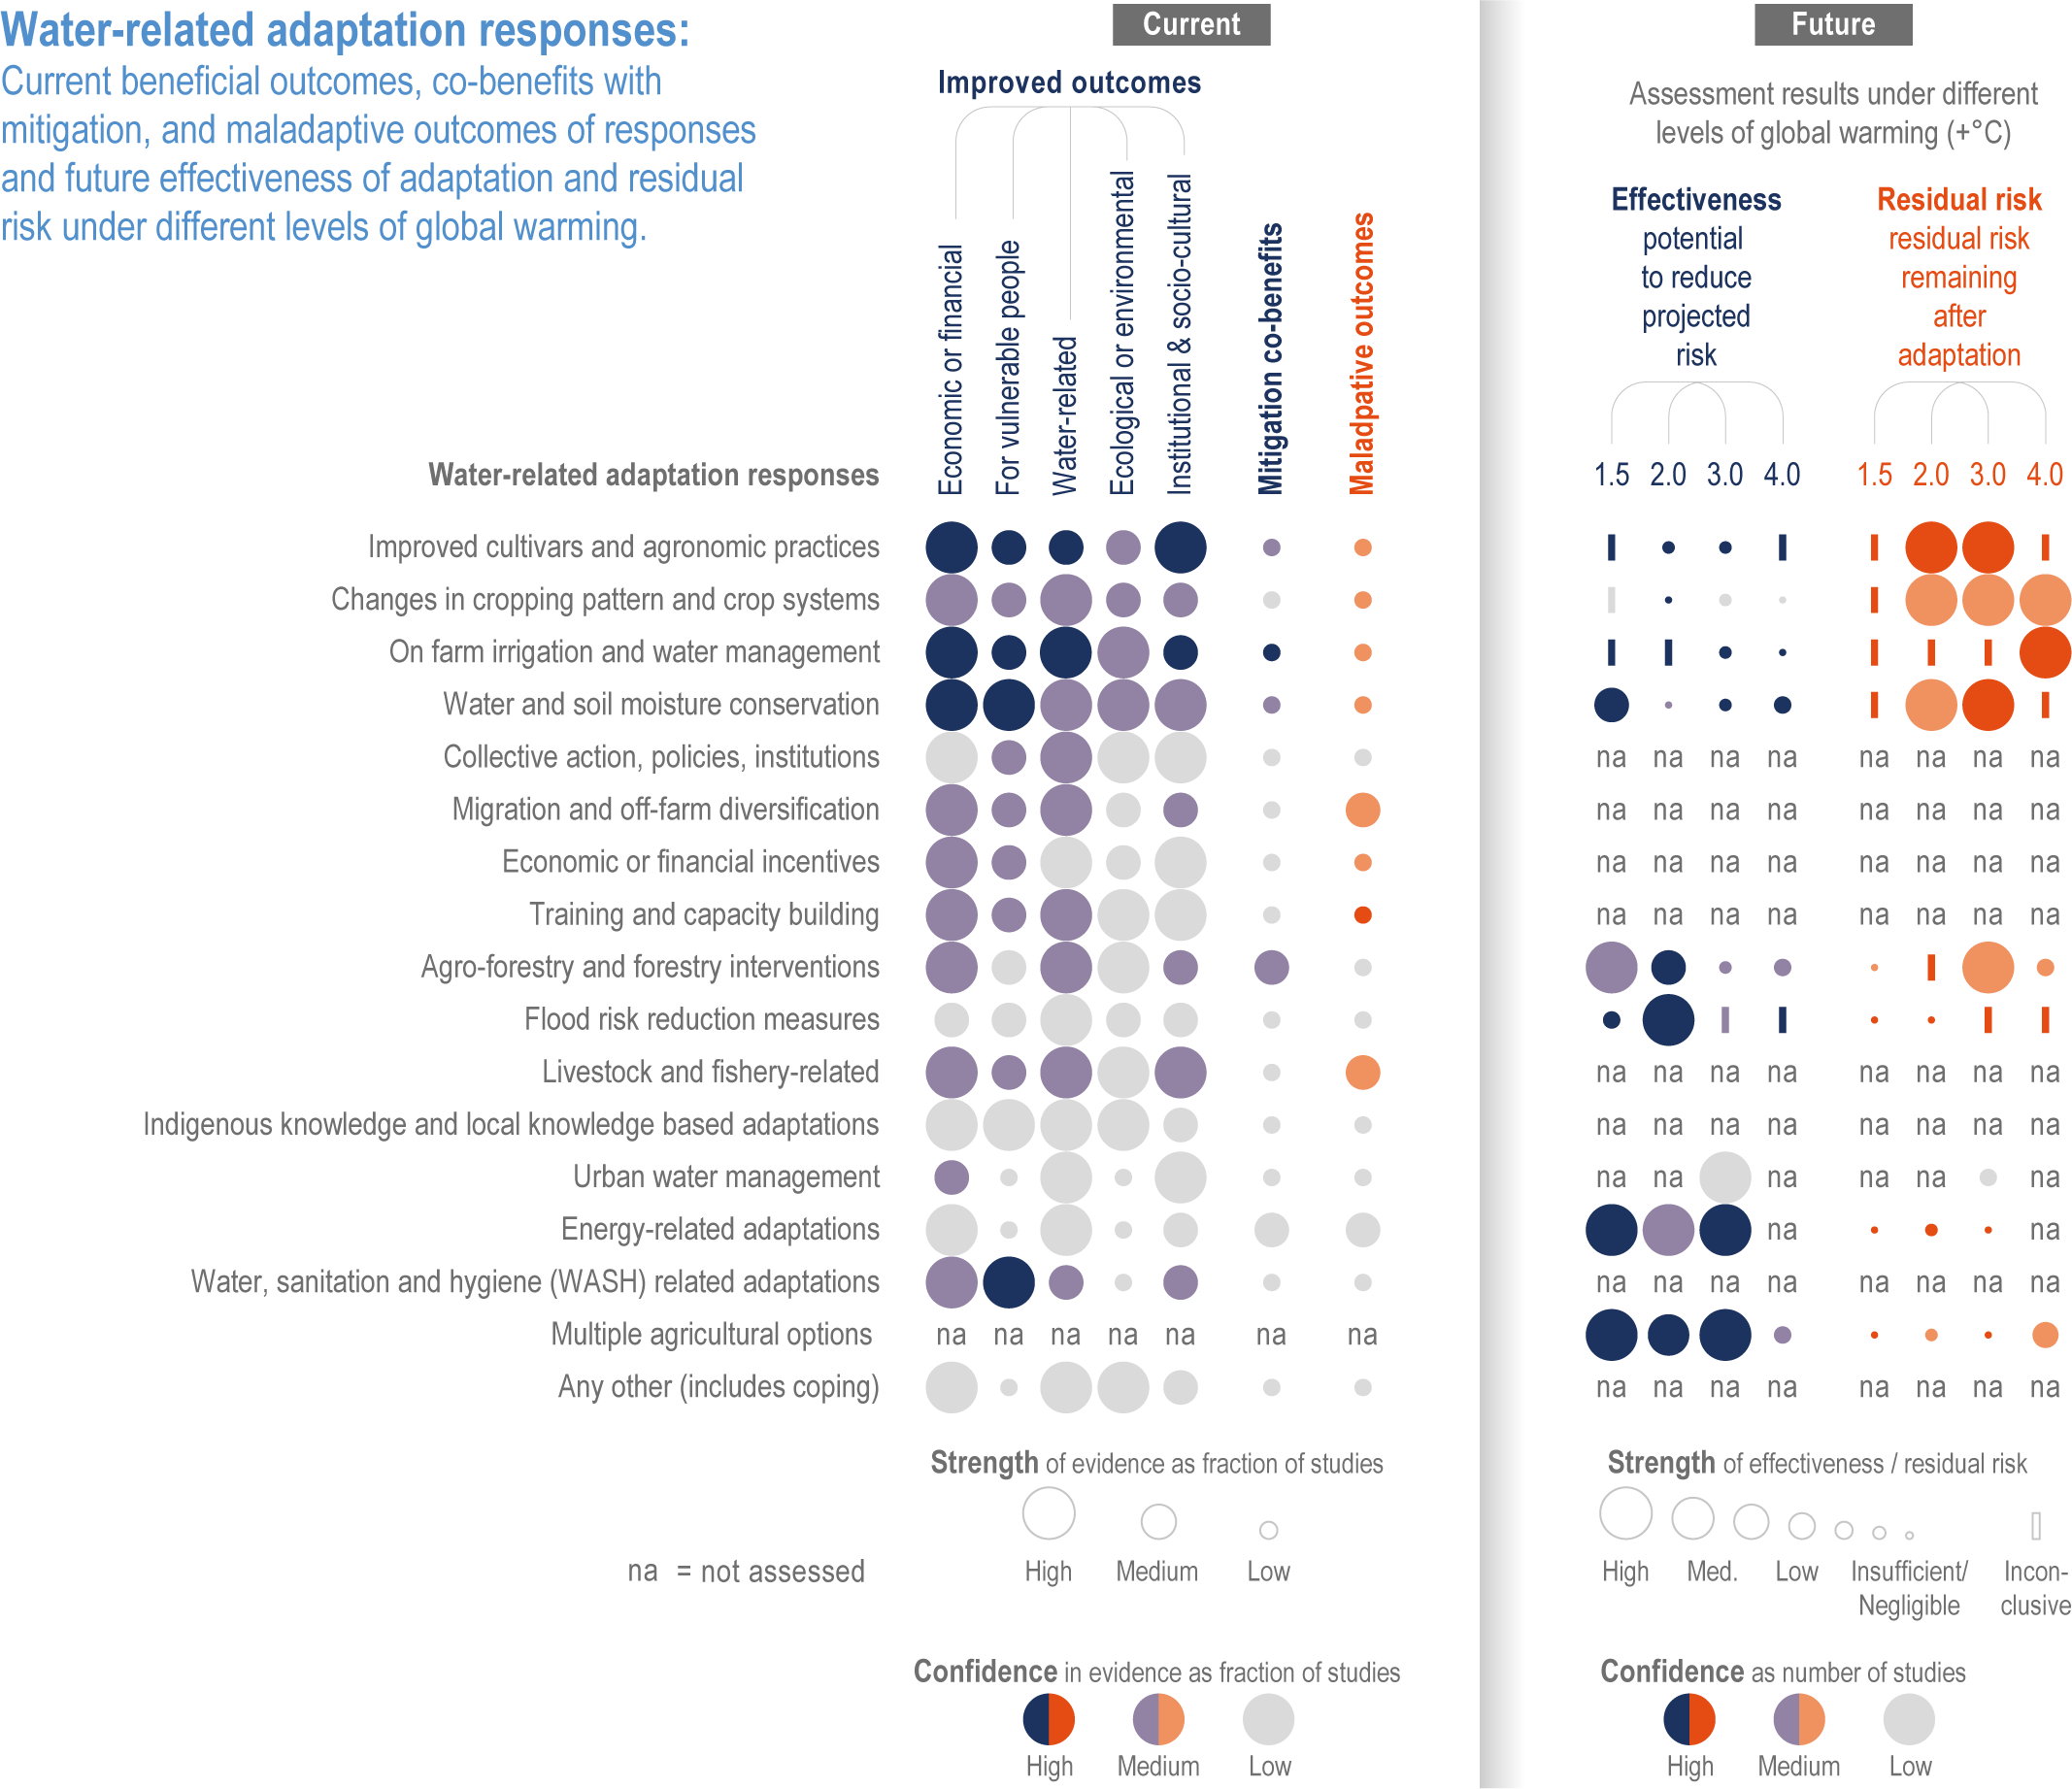
Figure caption
Figure 4.29 | The panel on the left side shows observed benefits of adaptation. Observed outcomes are reported across five dimensions of benefits, co-benefits and maladaptation outcomes. Benefits are measured across five dimensions. Strength of evidence is high if >80% of adaptation responses in that category have at least one beneficial outcome; medium if between 50 and 80% of adaptation responses in that category have at least one beneficial outcome, and low if <50% of adaptation responses have at least one beneficial outcome. Confidence in evidence relates to the way the article links outcomes of adaptation with the adaptation response. Category 1: studies causally link adaptation outcomes to the adaptation response by constructing credible counterfactuals; category 2: studies correlate responses and outcomes without causal attribution; category 3: studies describe adaptation outcomes without making any causal or correlation claims between adaptation outcomes and adaptation responses. High confidence: more than 67% of the studies fall in categories 1 and 2; medium confidence: 50–67% of the studies are in categories 1 and 2; low confidence is less than 50% of studies are in categories 1 and 2. The panel on the right-hand side shows the effectiveness of future adaptations. Future outcomes are assessed in terms of their effectiveness to reduce climate impacts at 1.5°C, 2°C, 3°C and 4°C of global temperature increase relative to 1850–1900. Effectiveness is defined as the fraction of adaptation that the option is able to reduce; residual risk is the fraction of risk remaining after adaptation. If >66% of assessed data points agree on the effectiveness class, a response–temperature combination is shown as belonging to that class. Where results diverge, the result is inconclusive, with studies showing high and low effectiveness across regions and studies. Confidence is based on the number of data points available for each response–temperature combination with high confidence: 5 or more data points; medium confidence: 2–4 data points; low confidence: 1 data point. Also, see Figure 4.28 for further explanations, and Tables SM4.5 and SM4.6 provide underlying data.