Back chapter figures
Figure 5.4
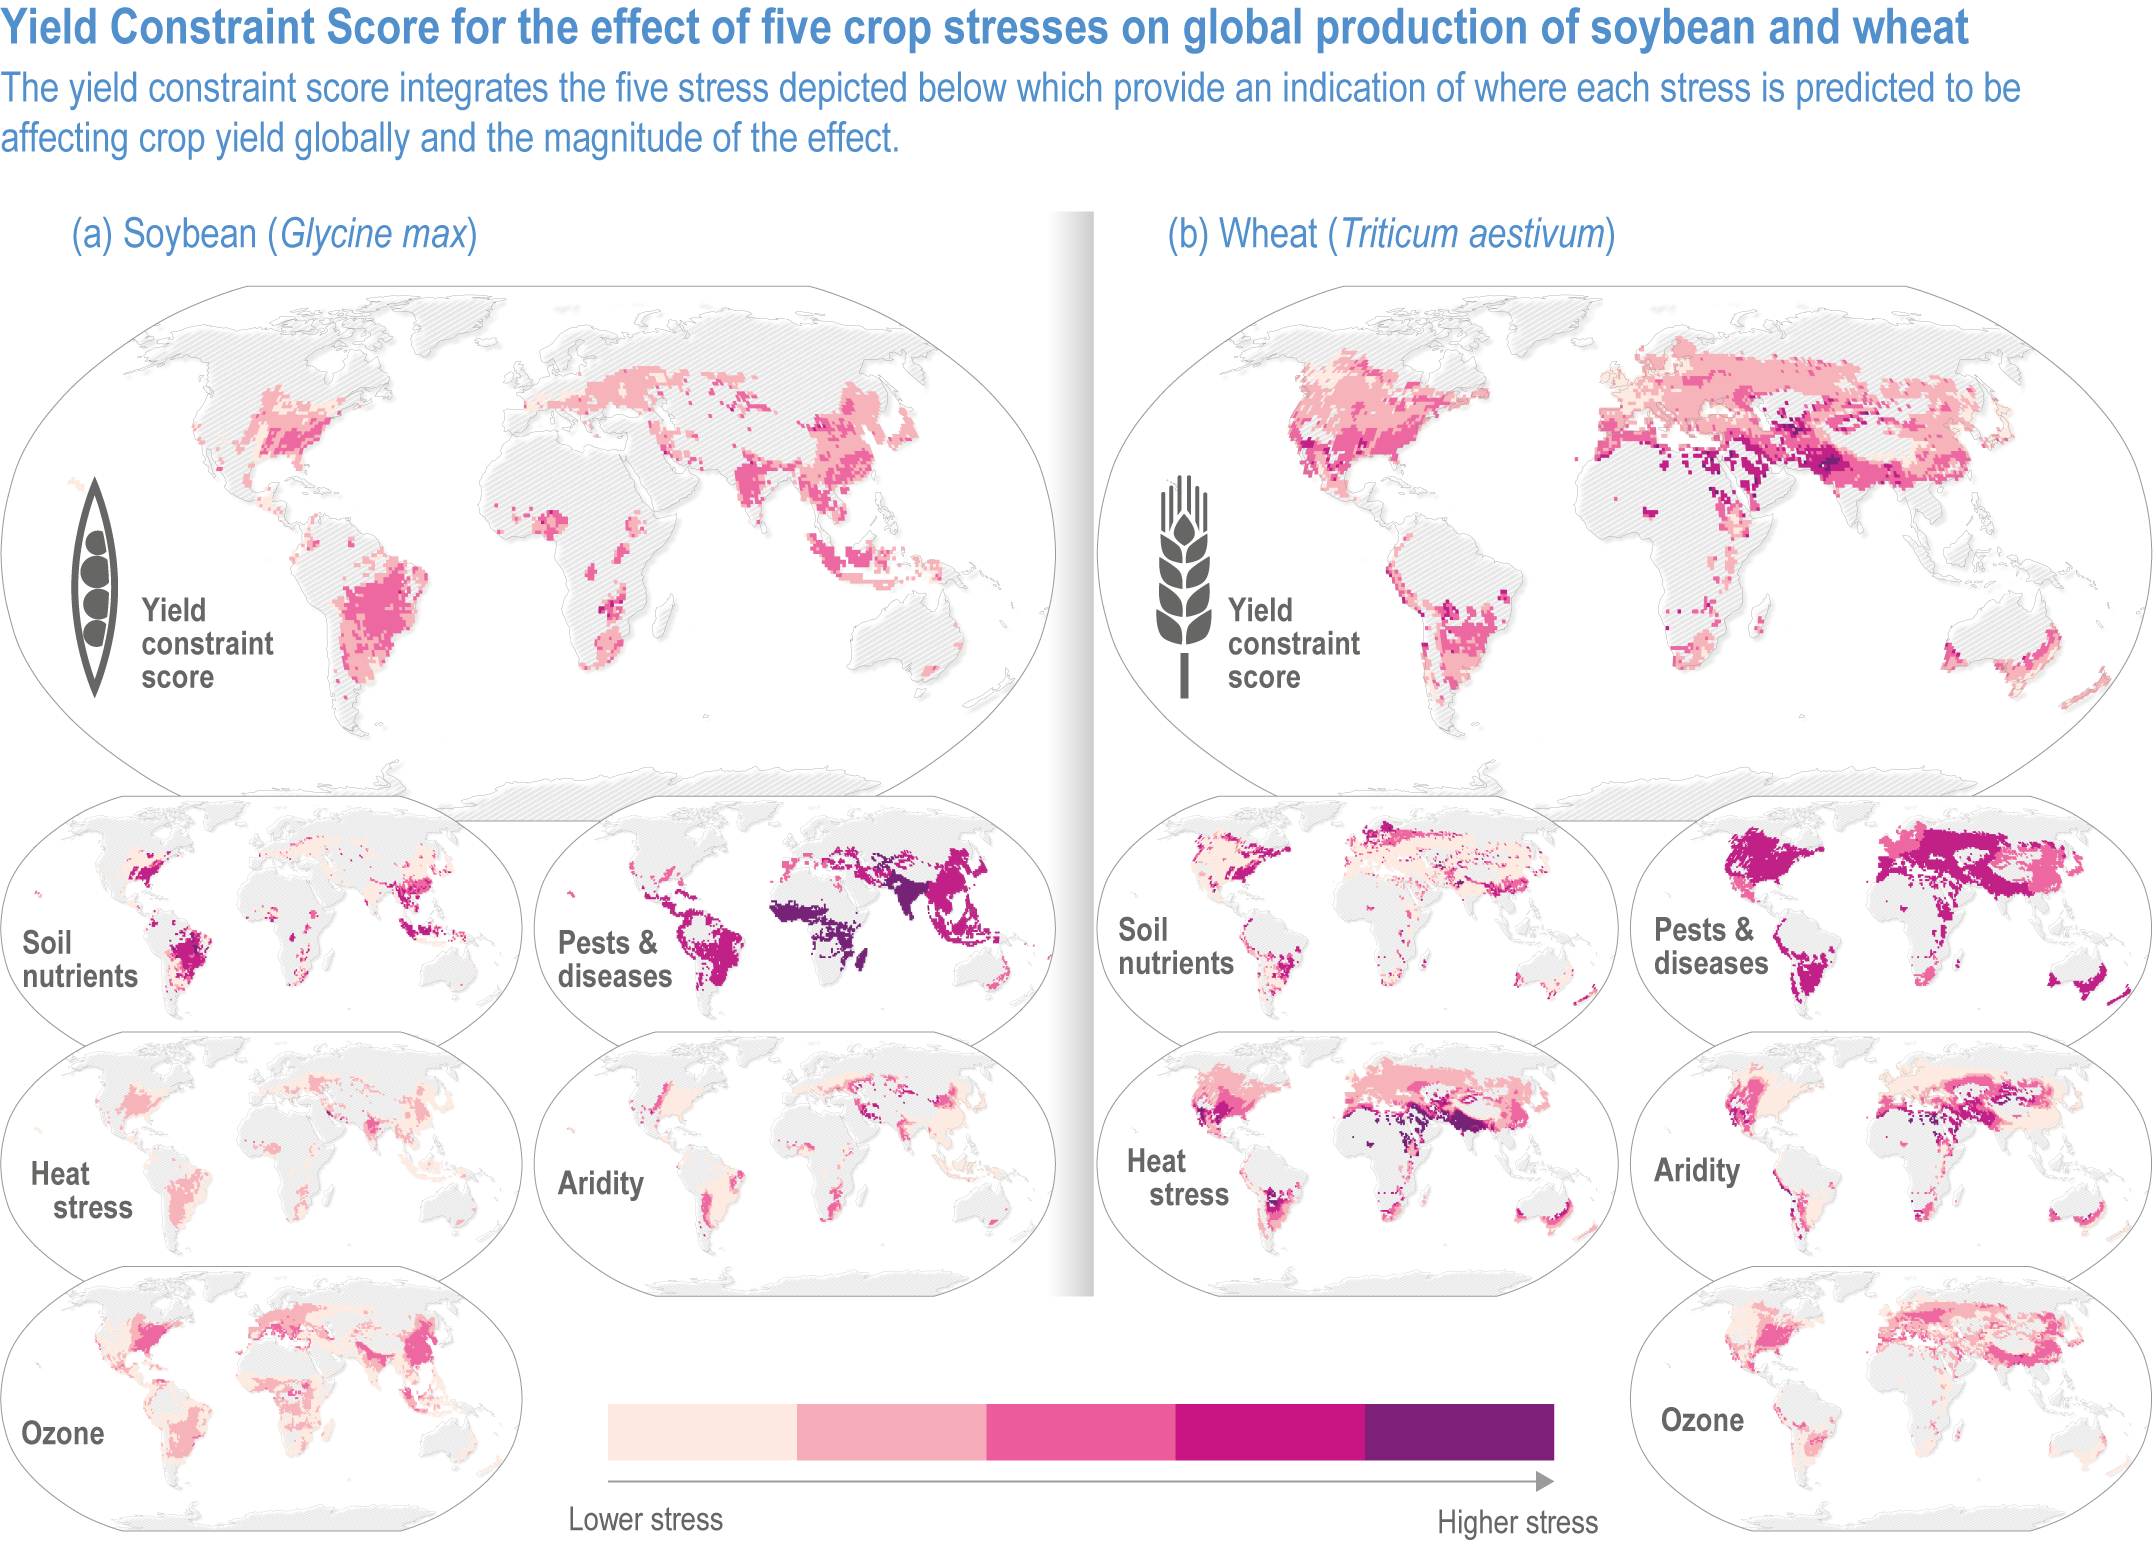
Figure caption
Figure 5.4 | The global effects of five biotic and abiotic stresses on soybean and wheat. All data are presented for the 1 × 1° (latitude and longitude) grid squares where the mean production of soybean or wheat was >500 tonnes (0.0005 Tg). The effect of each stress on yield is presented as a Yield Constraint Score (YCS) on a scale of 1–5, where 5 is the highest level of stress from ozone, pests and diseases, heat stress and aridity (Mills et al., 2018). Data are available at Sharps et al. (2020). See Annex I: Global to Regional Atlas for all four crops.