Back chapter figures
Figure 5.6
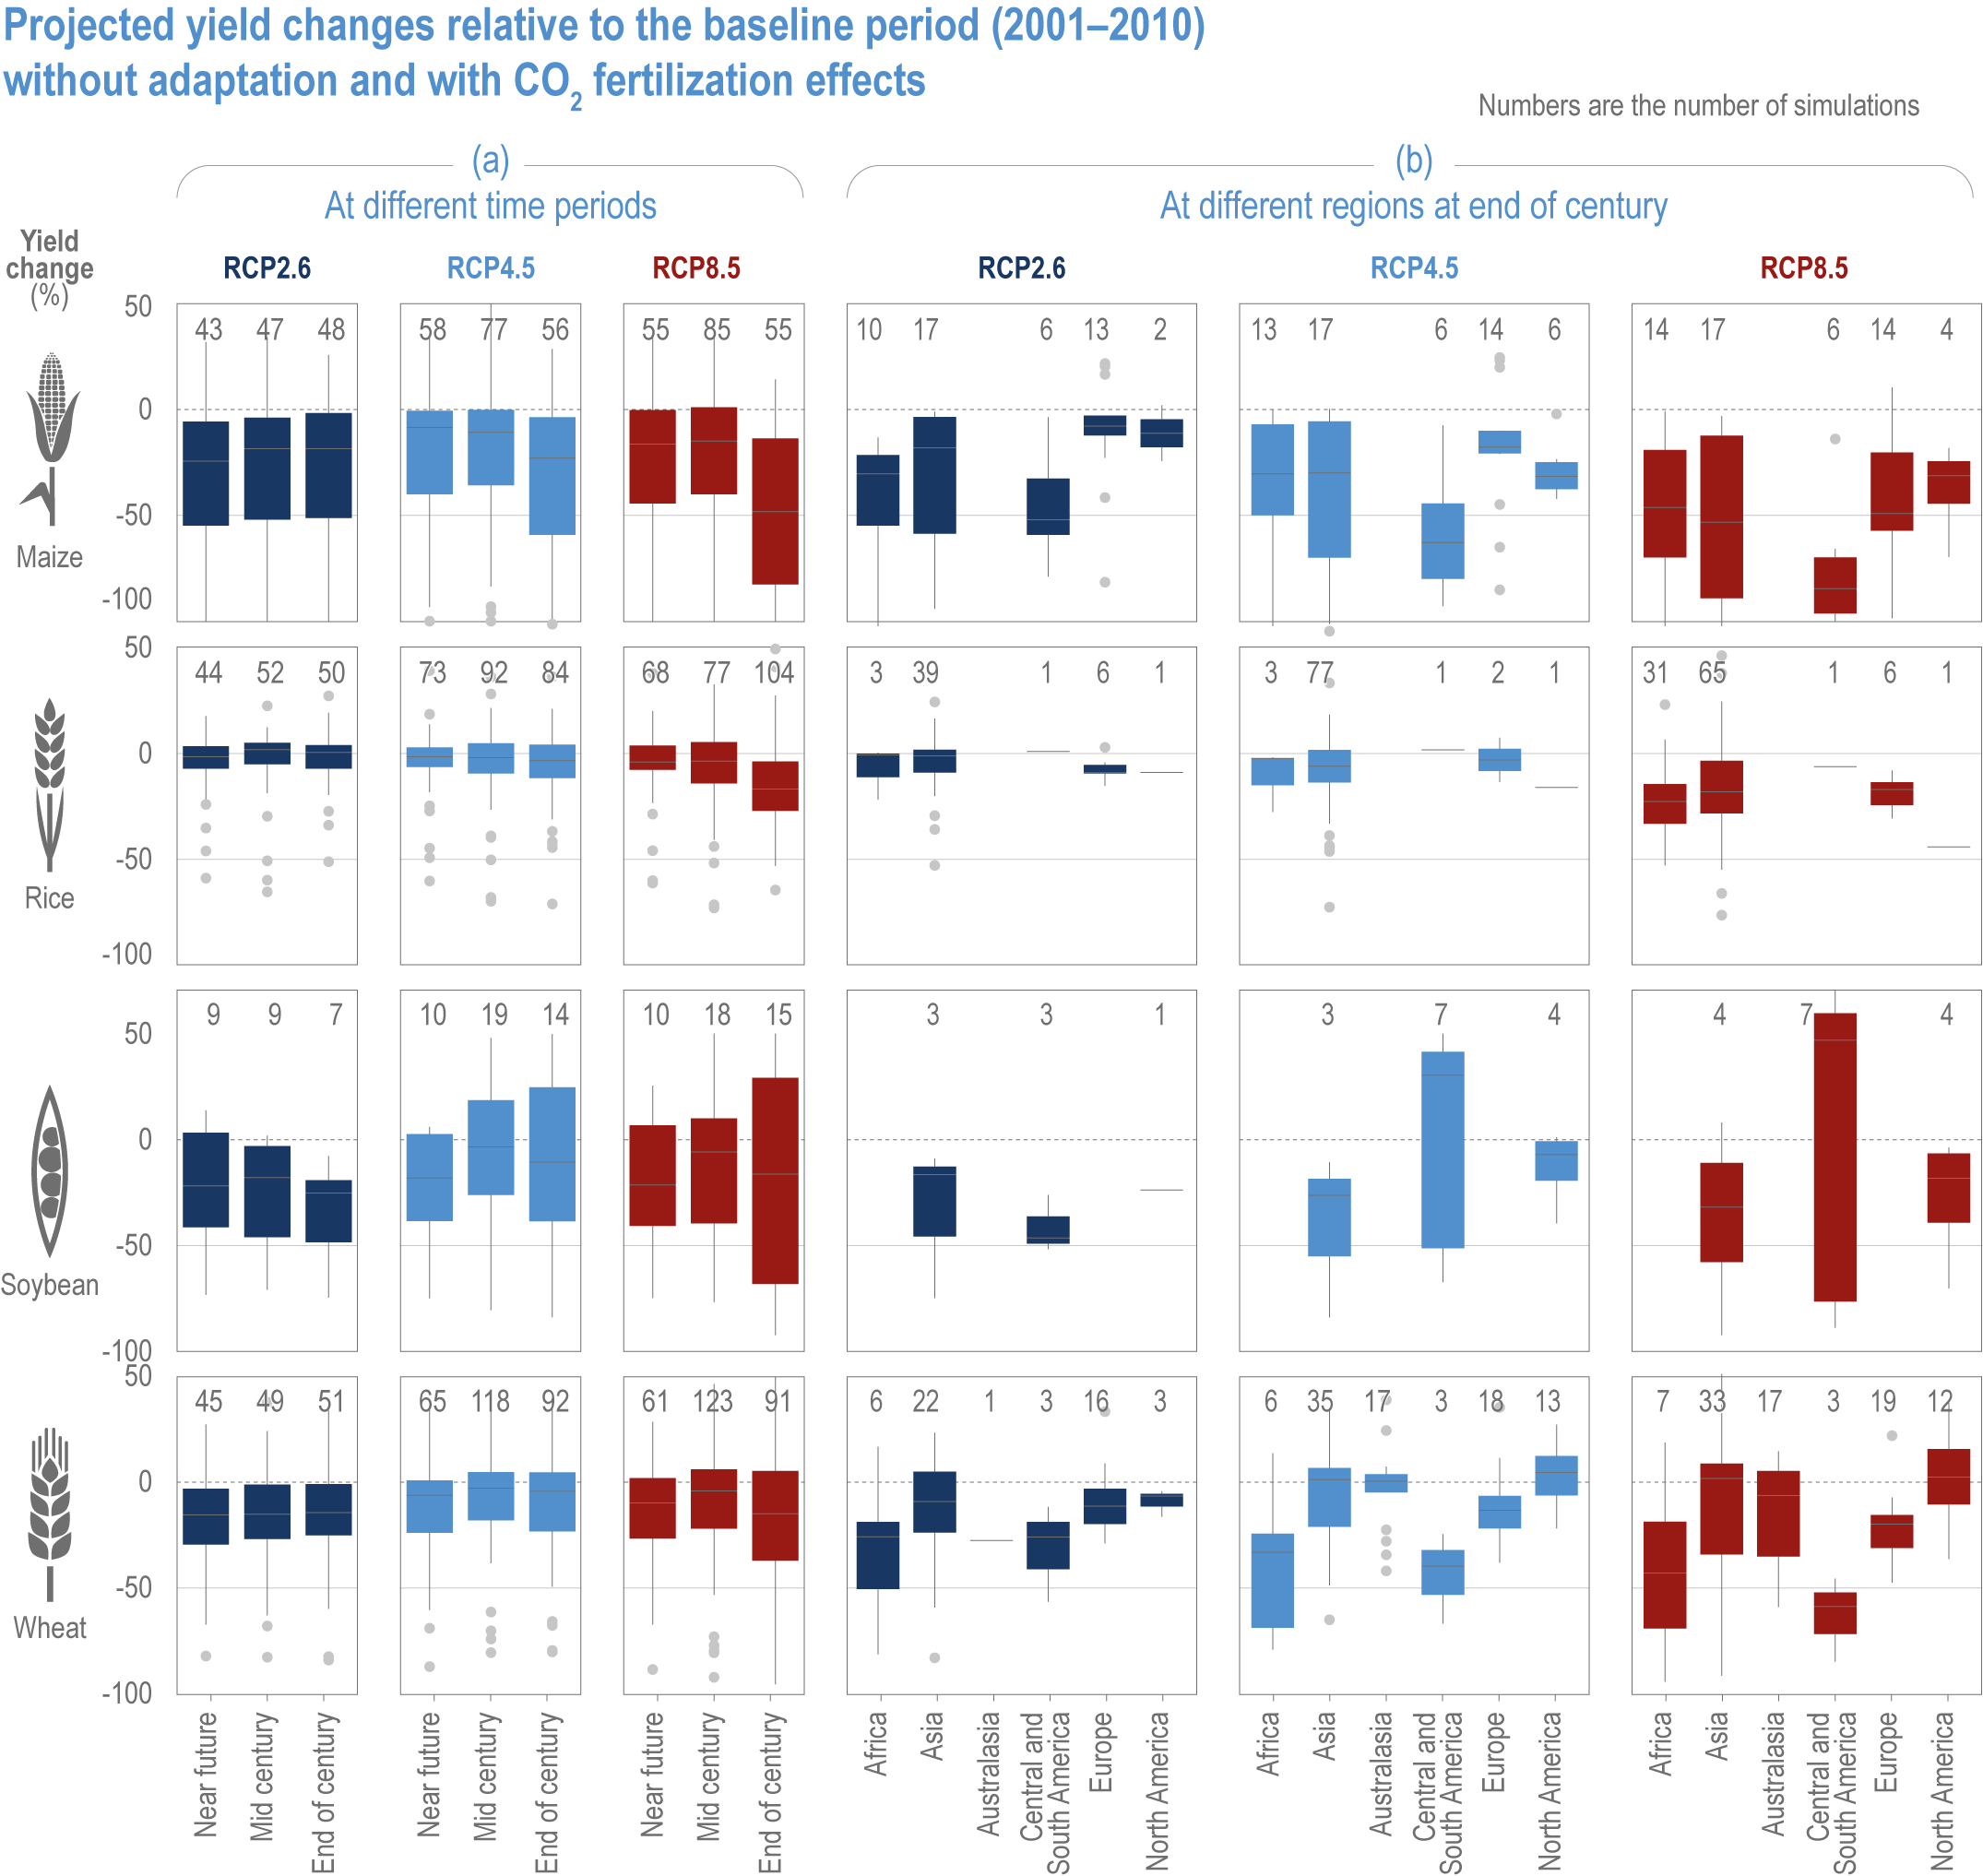
Figure caption
Figure 5.6 | Projected yield changes relative to the baseline period (2001–2010) without adaptation and with CO2 fertilisation effects (Hasegawa et al., 2021b). The box is the interquartile range (IQR), and the middle line in the box represents the median. The upper and lower end of whiskers are median 1.5 × IQR ± median. Open circles are values outside the 1.5 × IQR. (a) At different time periods (near future, NF, baseline to 2039; mid-century, MC, 2040–2069; end-century, EC, 2070–2100) under three RCPs, and (b) at different regions at EC.