Back chapter figures
Figure 5.7
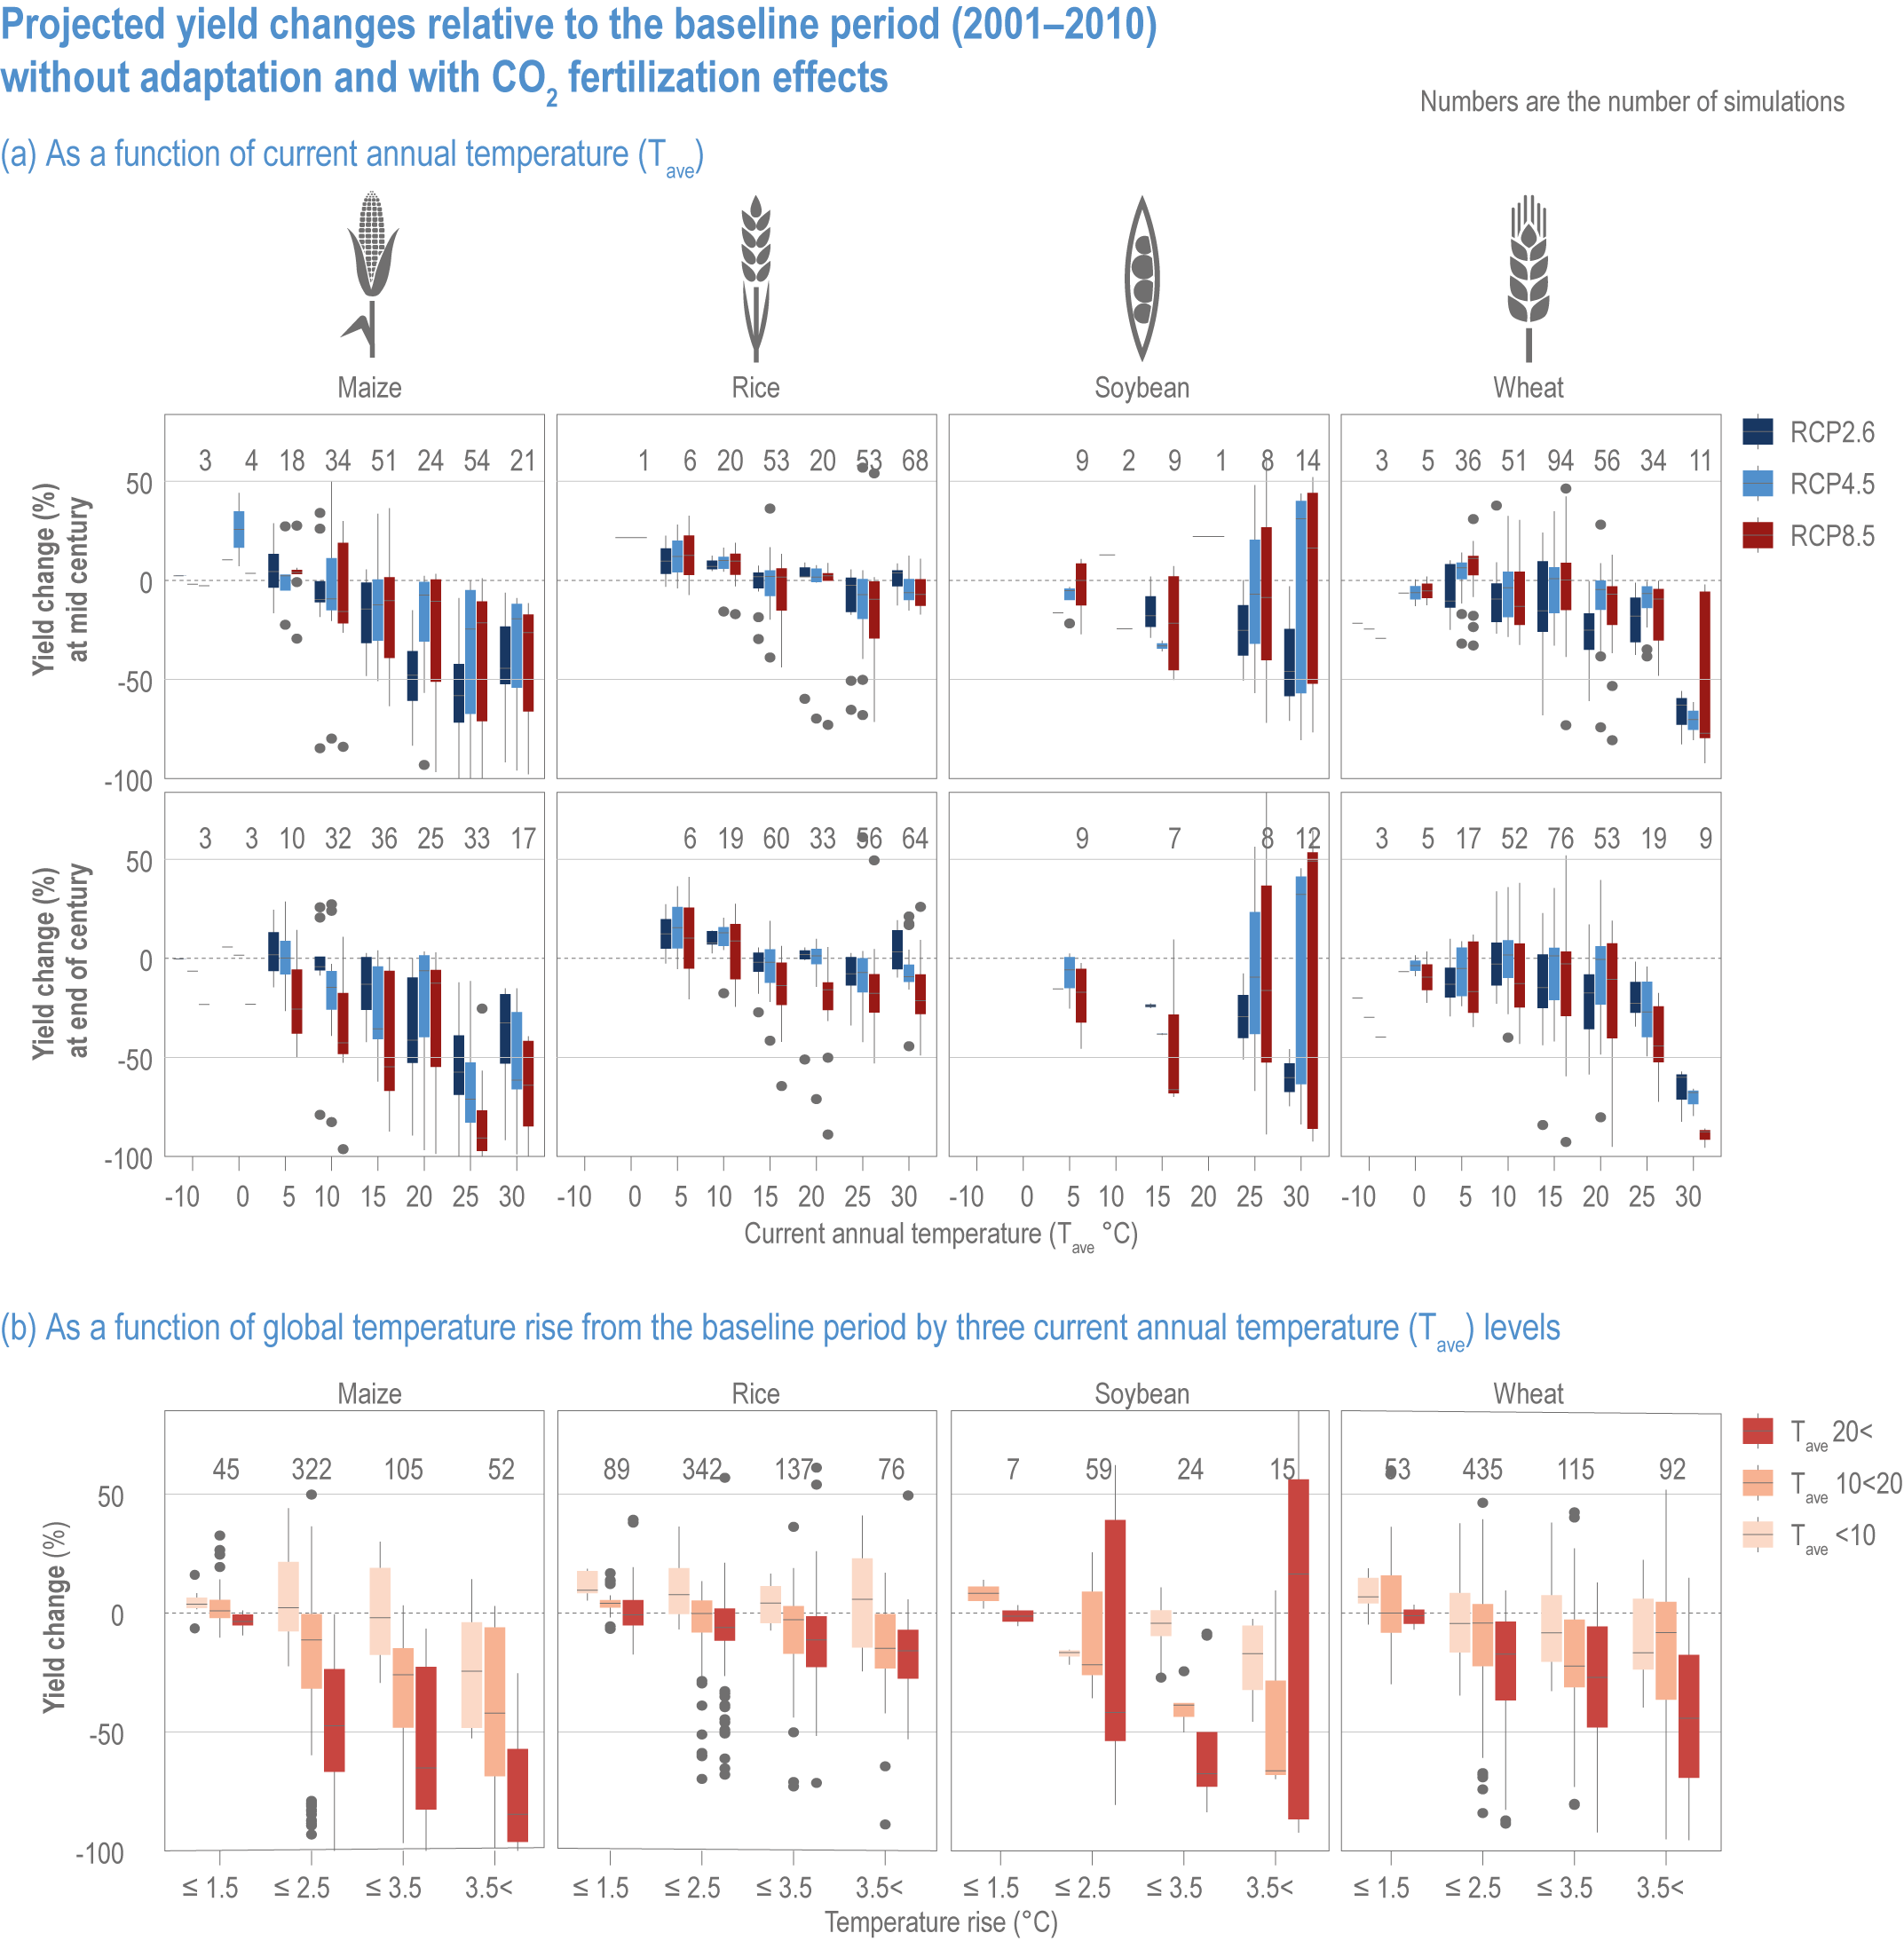
Figure caption
Figure 5.7 | Projected yield changes relative to the baseline period (2001–2010) without adaptation and with CO2 fertilisation effects (Hasegawa et al., 2021b). (a) Mid-century (MC, 2040–2069) and end-century (EC, 2070–2100) projections under three RCP scenarios as a function of current annual temperature (Tave), (b) as a function of global temperature rise from the baseline period by three Tave levels. See Figure. 5.6 for legends.