Back chapter figures
Figure 5.12
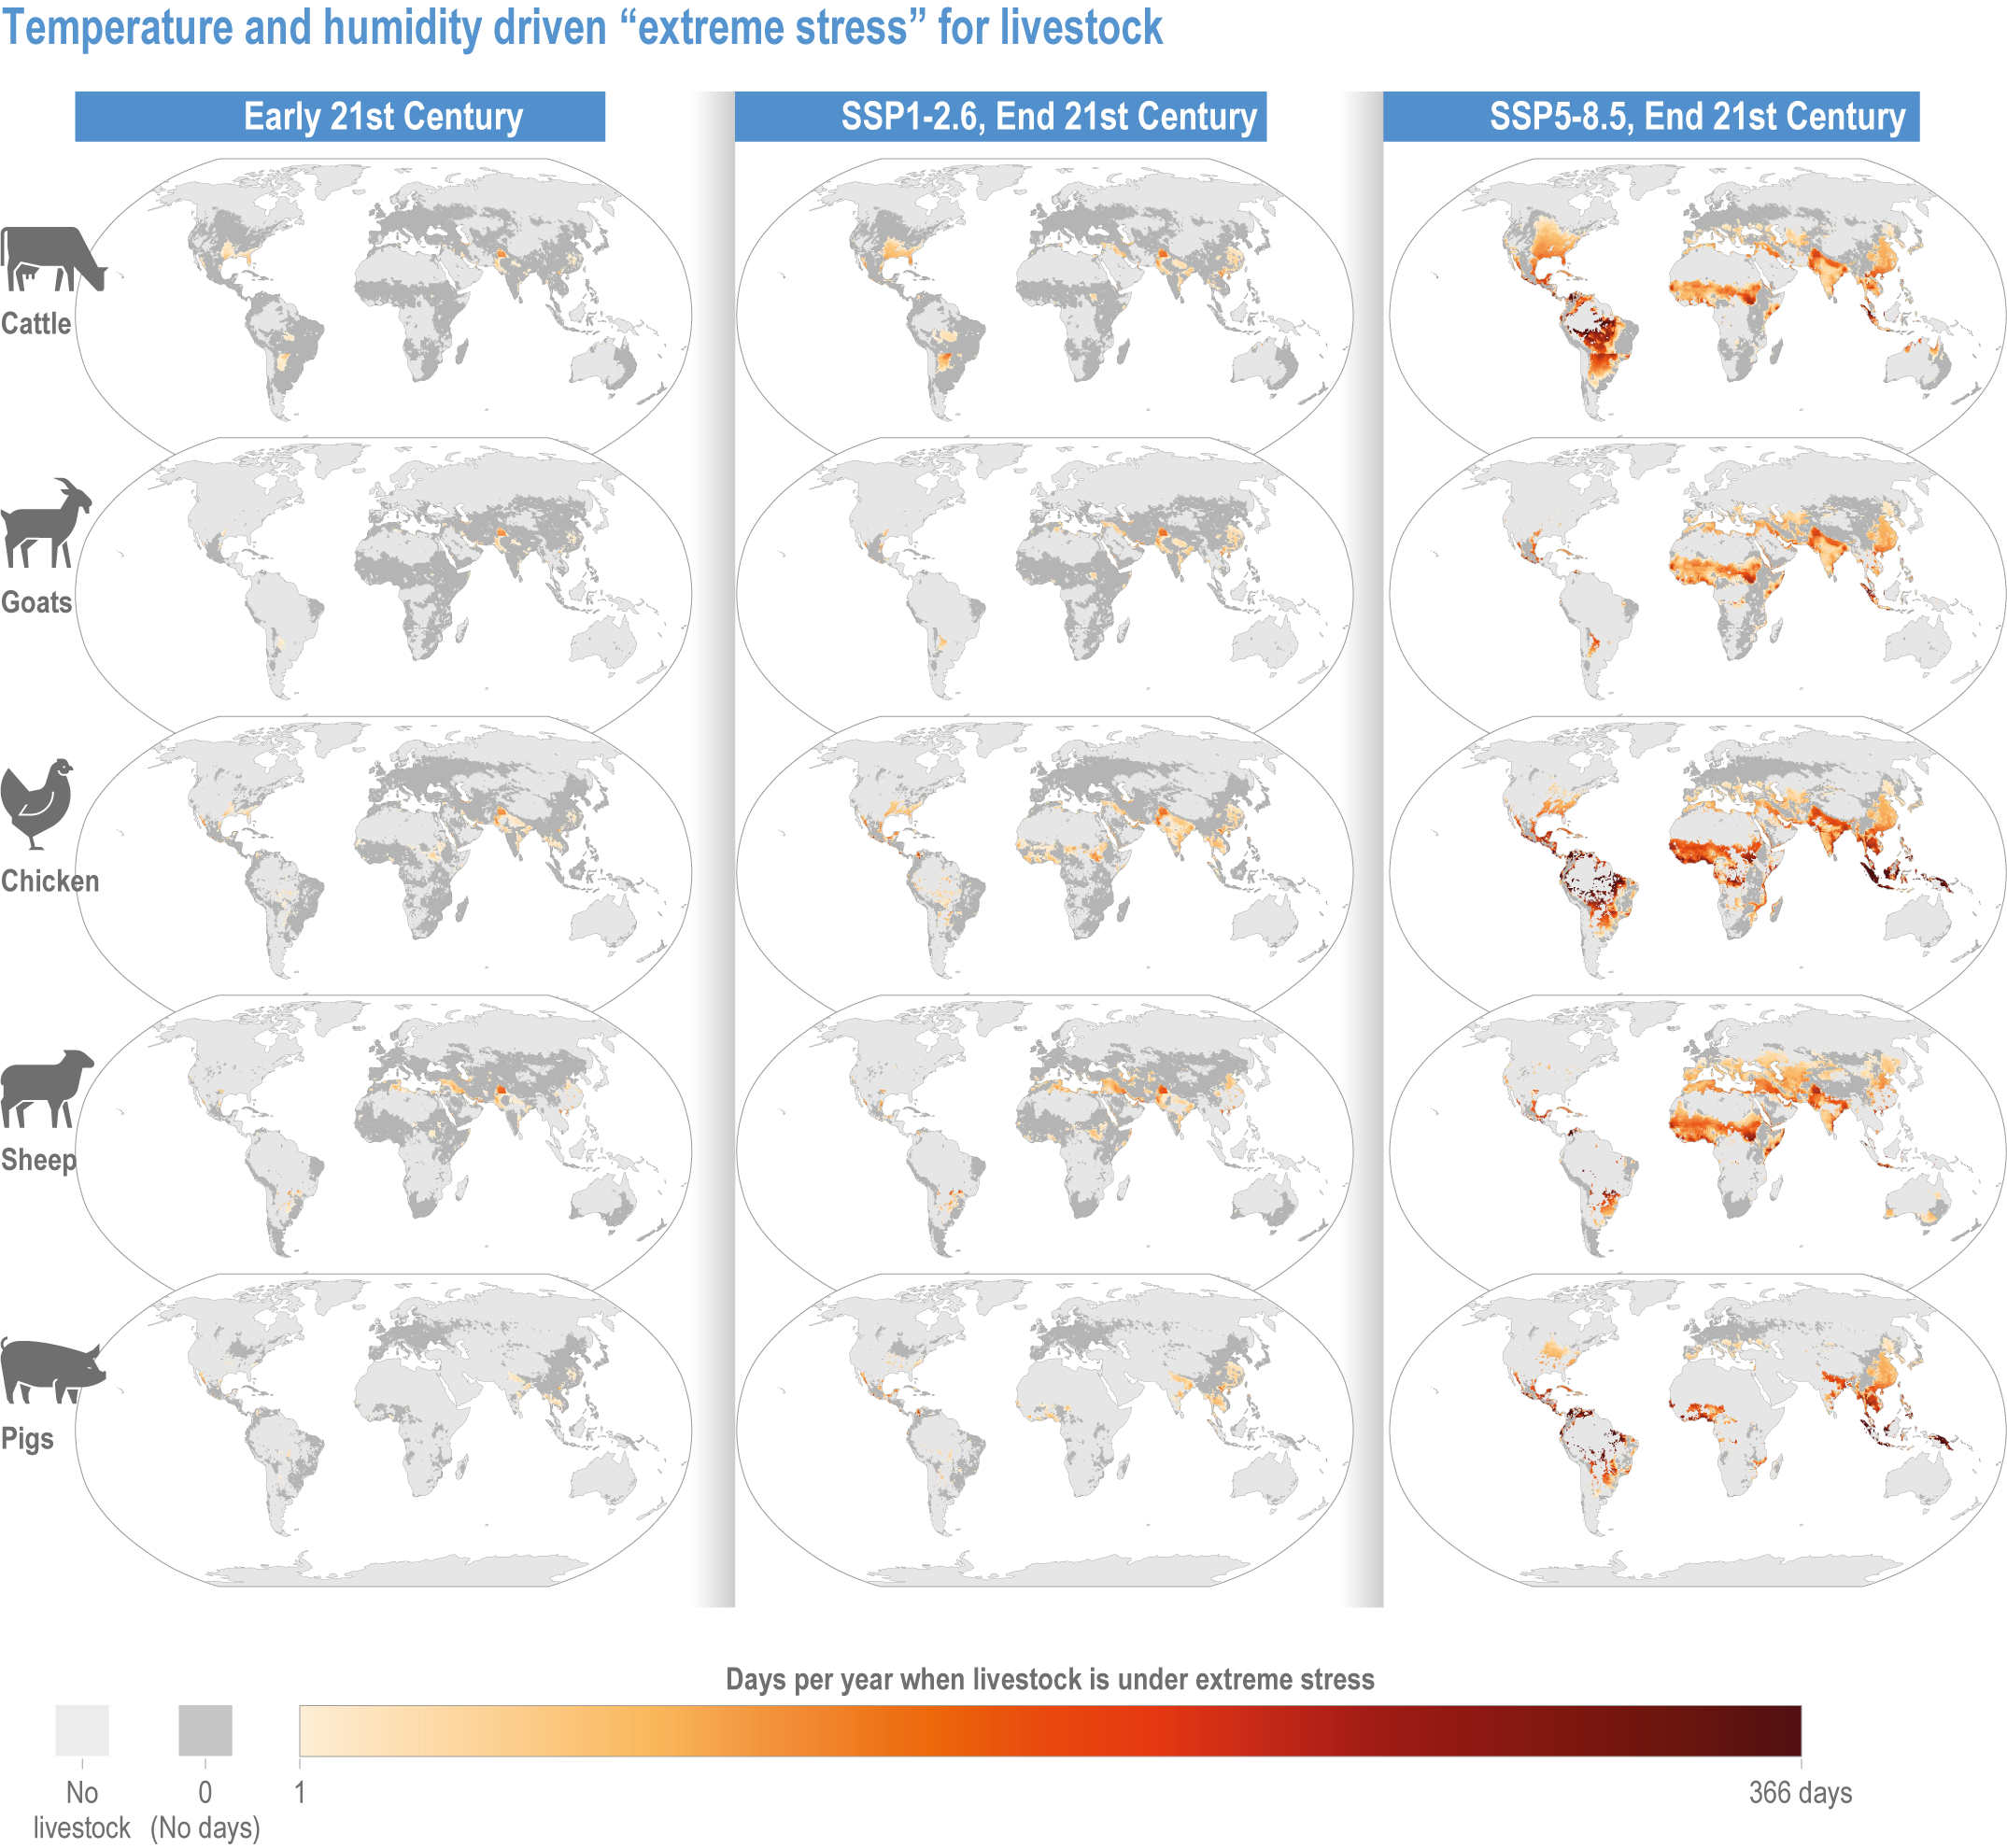
Figure caption
Figure 5.12 | Change in the number of days per year above ‘extreme stress’ values from the early 21st century (1991–2010) to end of century (2081–2100), estimated under SSP1-2.6 and SSP5-8.5 using the Temperature Humidity Index (THI). Mapped for species current global distribution (Gilbert et al., 2018) (grey areas, no change). (Thornton et al., 2021), Also see Annex I: Global to Regional Atlas.