Back chapter figures
Figure 5.19
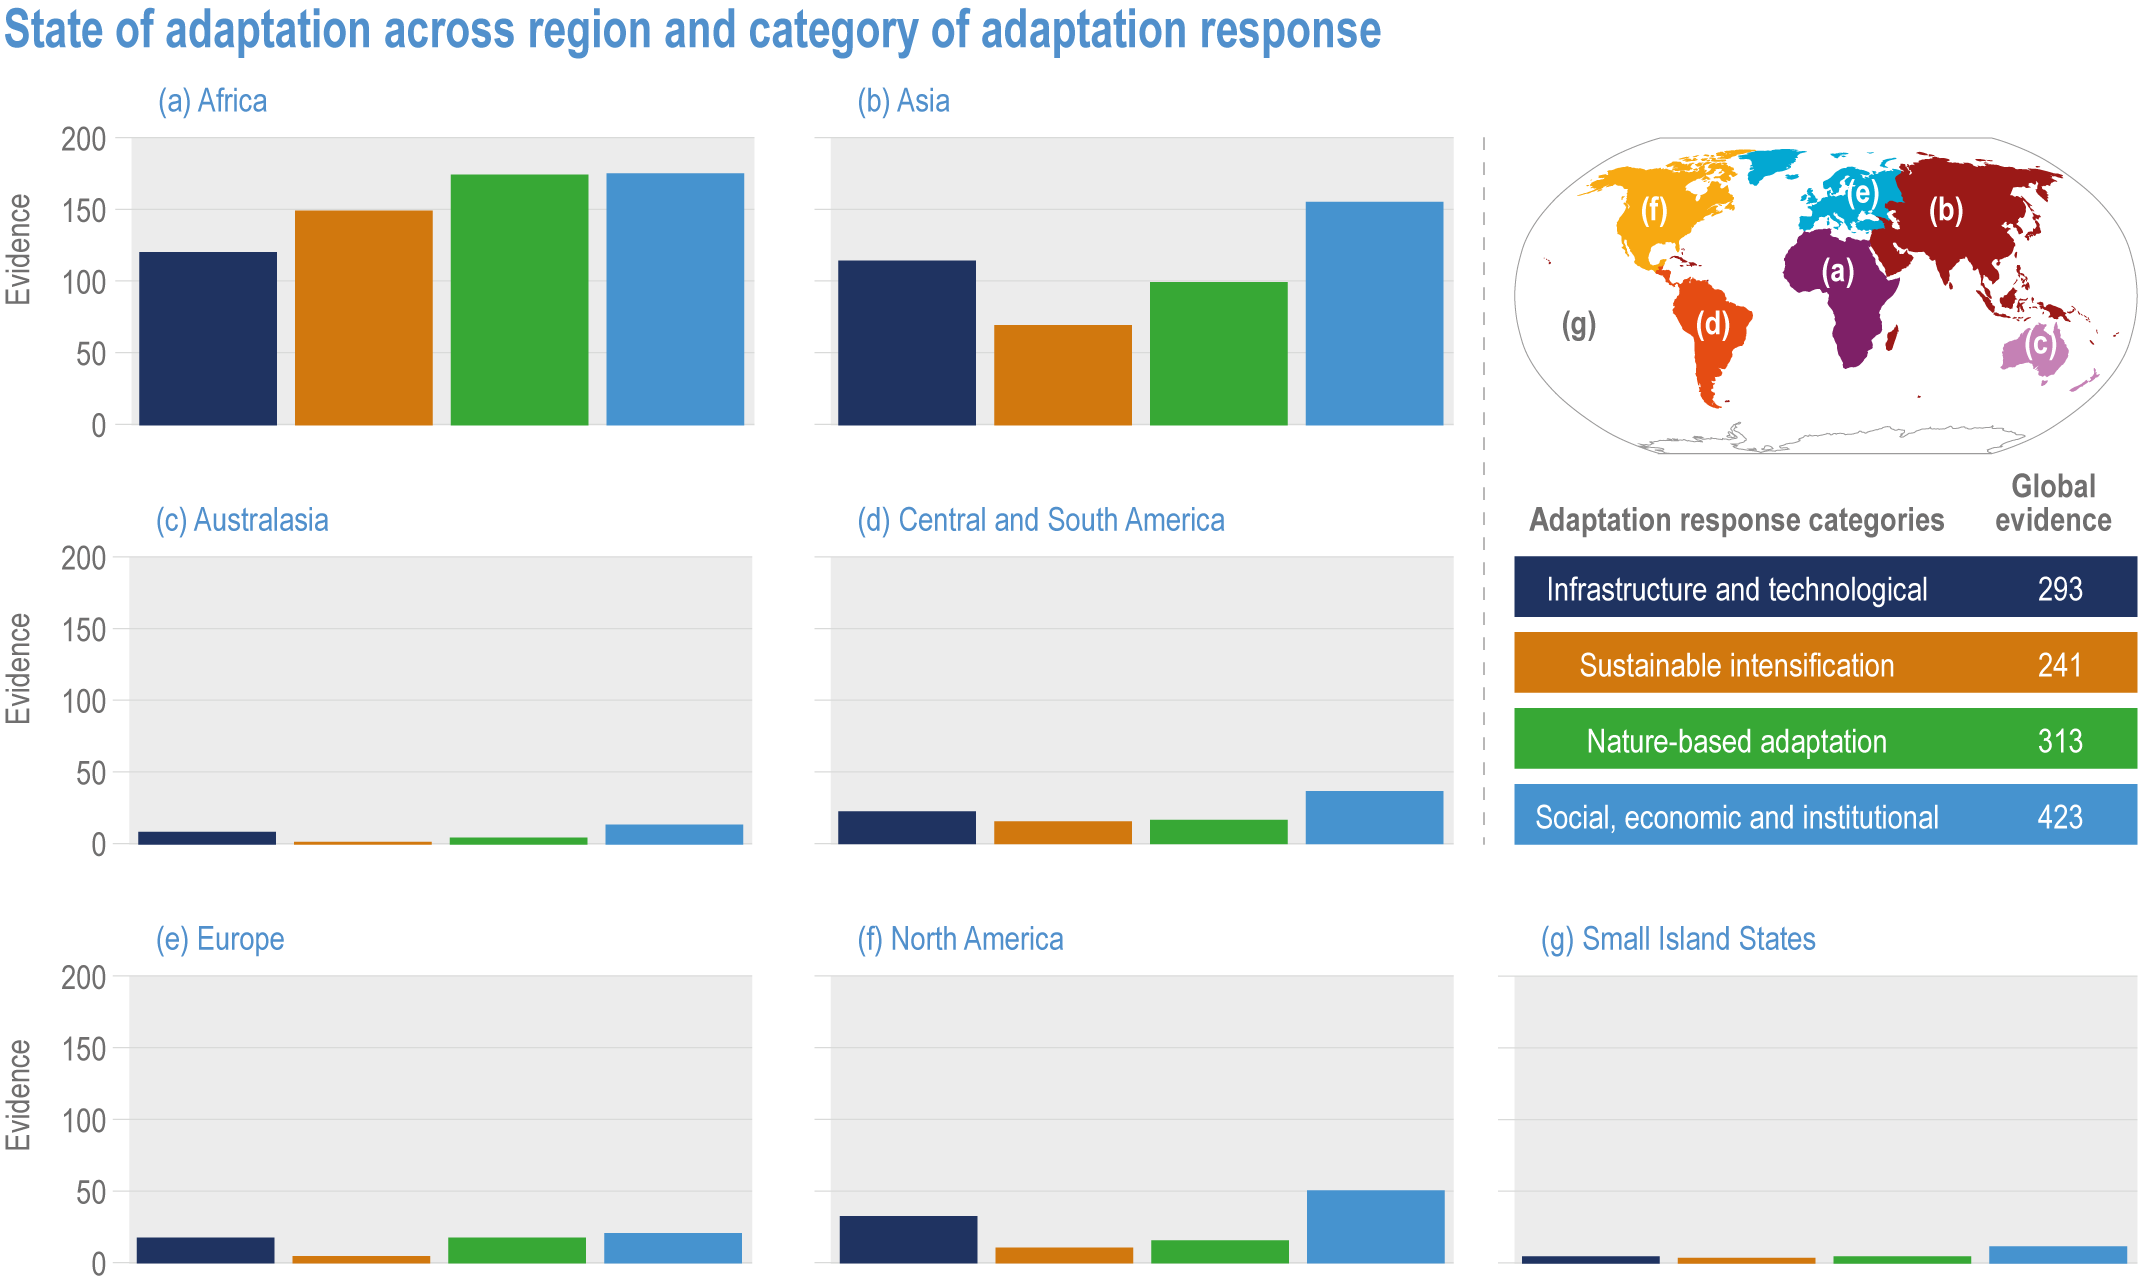
Figure caption
Figure 5.19 | State of adaptation by region and type of response (based on 1159 peer-reviewed references that addressed adaptation in food, fibre and other ecosystem products sector; source: Global Adaptation Mapping Initiative (GAMI) database (Berrang-Ford et al., 2021a). The bars indicate the amount of evidence for the category x region.