Figure Cross-Chapter Box MOVING PLATE.1
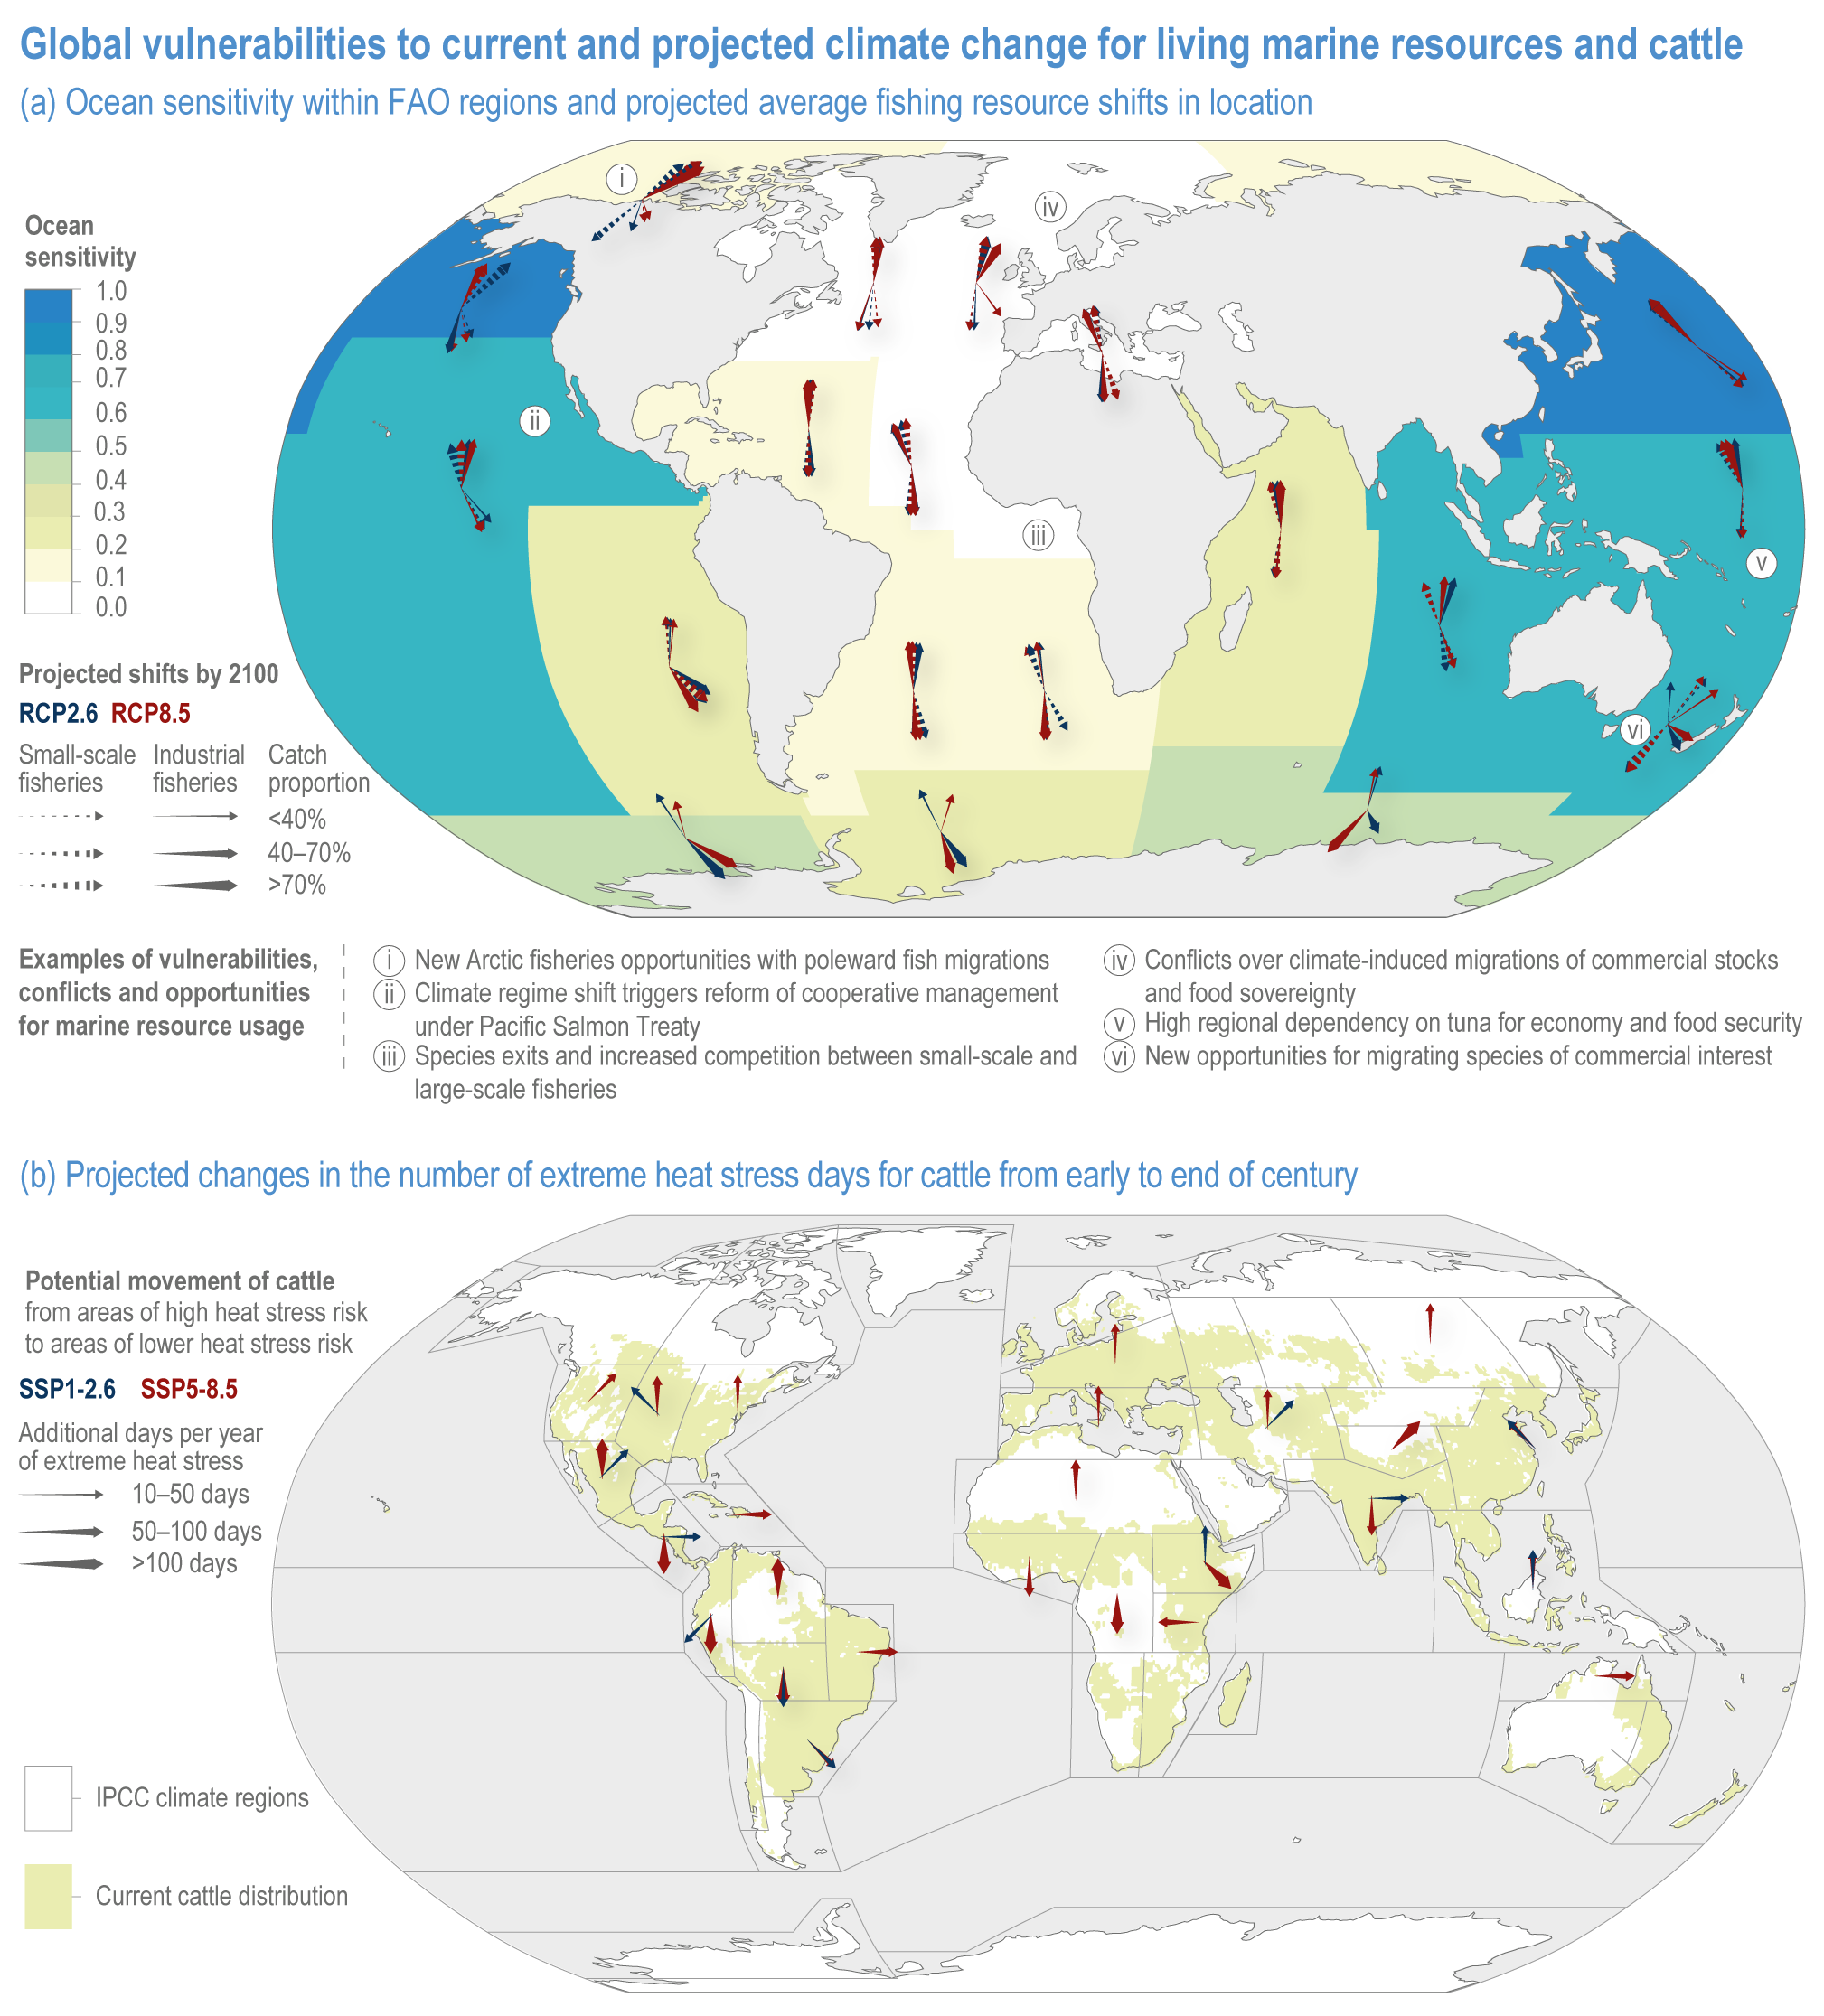
Figure caption
Figure Cross-Chapter Box MOVING PLATE.1 | Global vulnerabilities to current and projected climate change for living marine resources and cattle.
(a) Ocean areas are delineated into FAO (Food and Agricultural Organization of the United Nations) regions. Ocean sensitivity is calculated from aggregated sensitivities from Blasiak et al. (2017) S1 country data based on number of fishers, fisheries exports, proportions of economically active population working as fishers, total fisheries landings and nutritional dependence, which was subsequently re-analysed for each FAO region depicted here. Arrows denote projected average commercial and artisanal fishing resource shifts in location under RCP2.6 and under RCP8.5 (dark-blue and red arrows, respectively) scenarios by 2100. Text boxes highlight examples of vulnerabilities (Bell et al., 2018 a), conflicts (Miller et al., 2013; Blasiak et al., 2017; Østhagen et al., 2020) or opportunities for marine resource usage (Robinson et al., 2015; Stuart-Smith et al., 2018; Meredith et al., 2019).
(b) Projected changes in the number of extreme heat stress days for cattle from early (1991–2010) to end of century (2081–2100) under SSP1-2.6 and SSP5-8.5, shown as arrows rooted in the most affected area in each IPCC sub-region pointing to the nearest area of reduced or no extreme heat stress. Arrows are shown only for sub-regions where >1 million additional animals are affected. Areas in green are those with >5000 animals per 0.5° grid cell in the eary 21st century (Thornton et al., 2021).