Menu
IPCC Sixth Assessment Report
Impacts, Adaptation and Vulnerability
About
Report
Resources
Download
Back chapter figures
Figure FAQ5.1.1
Download
How to cite
Figure caption
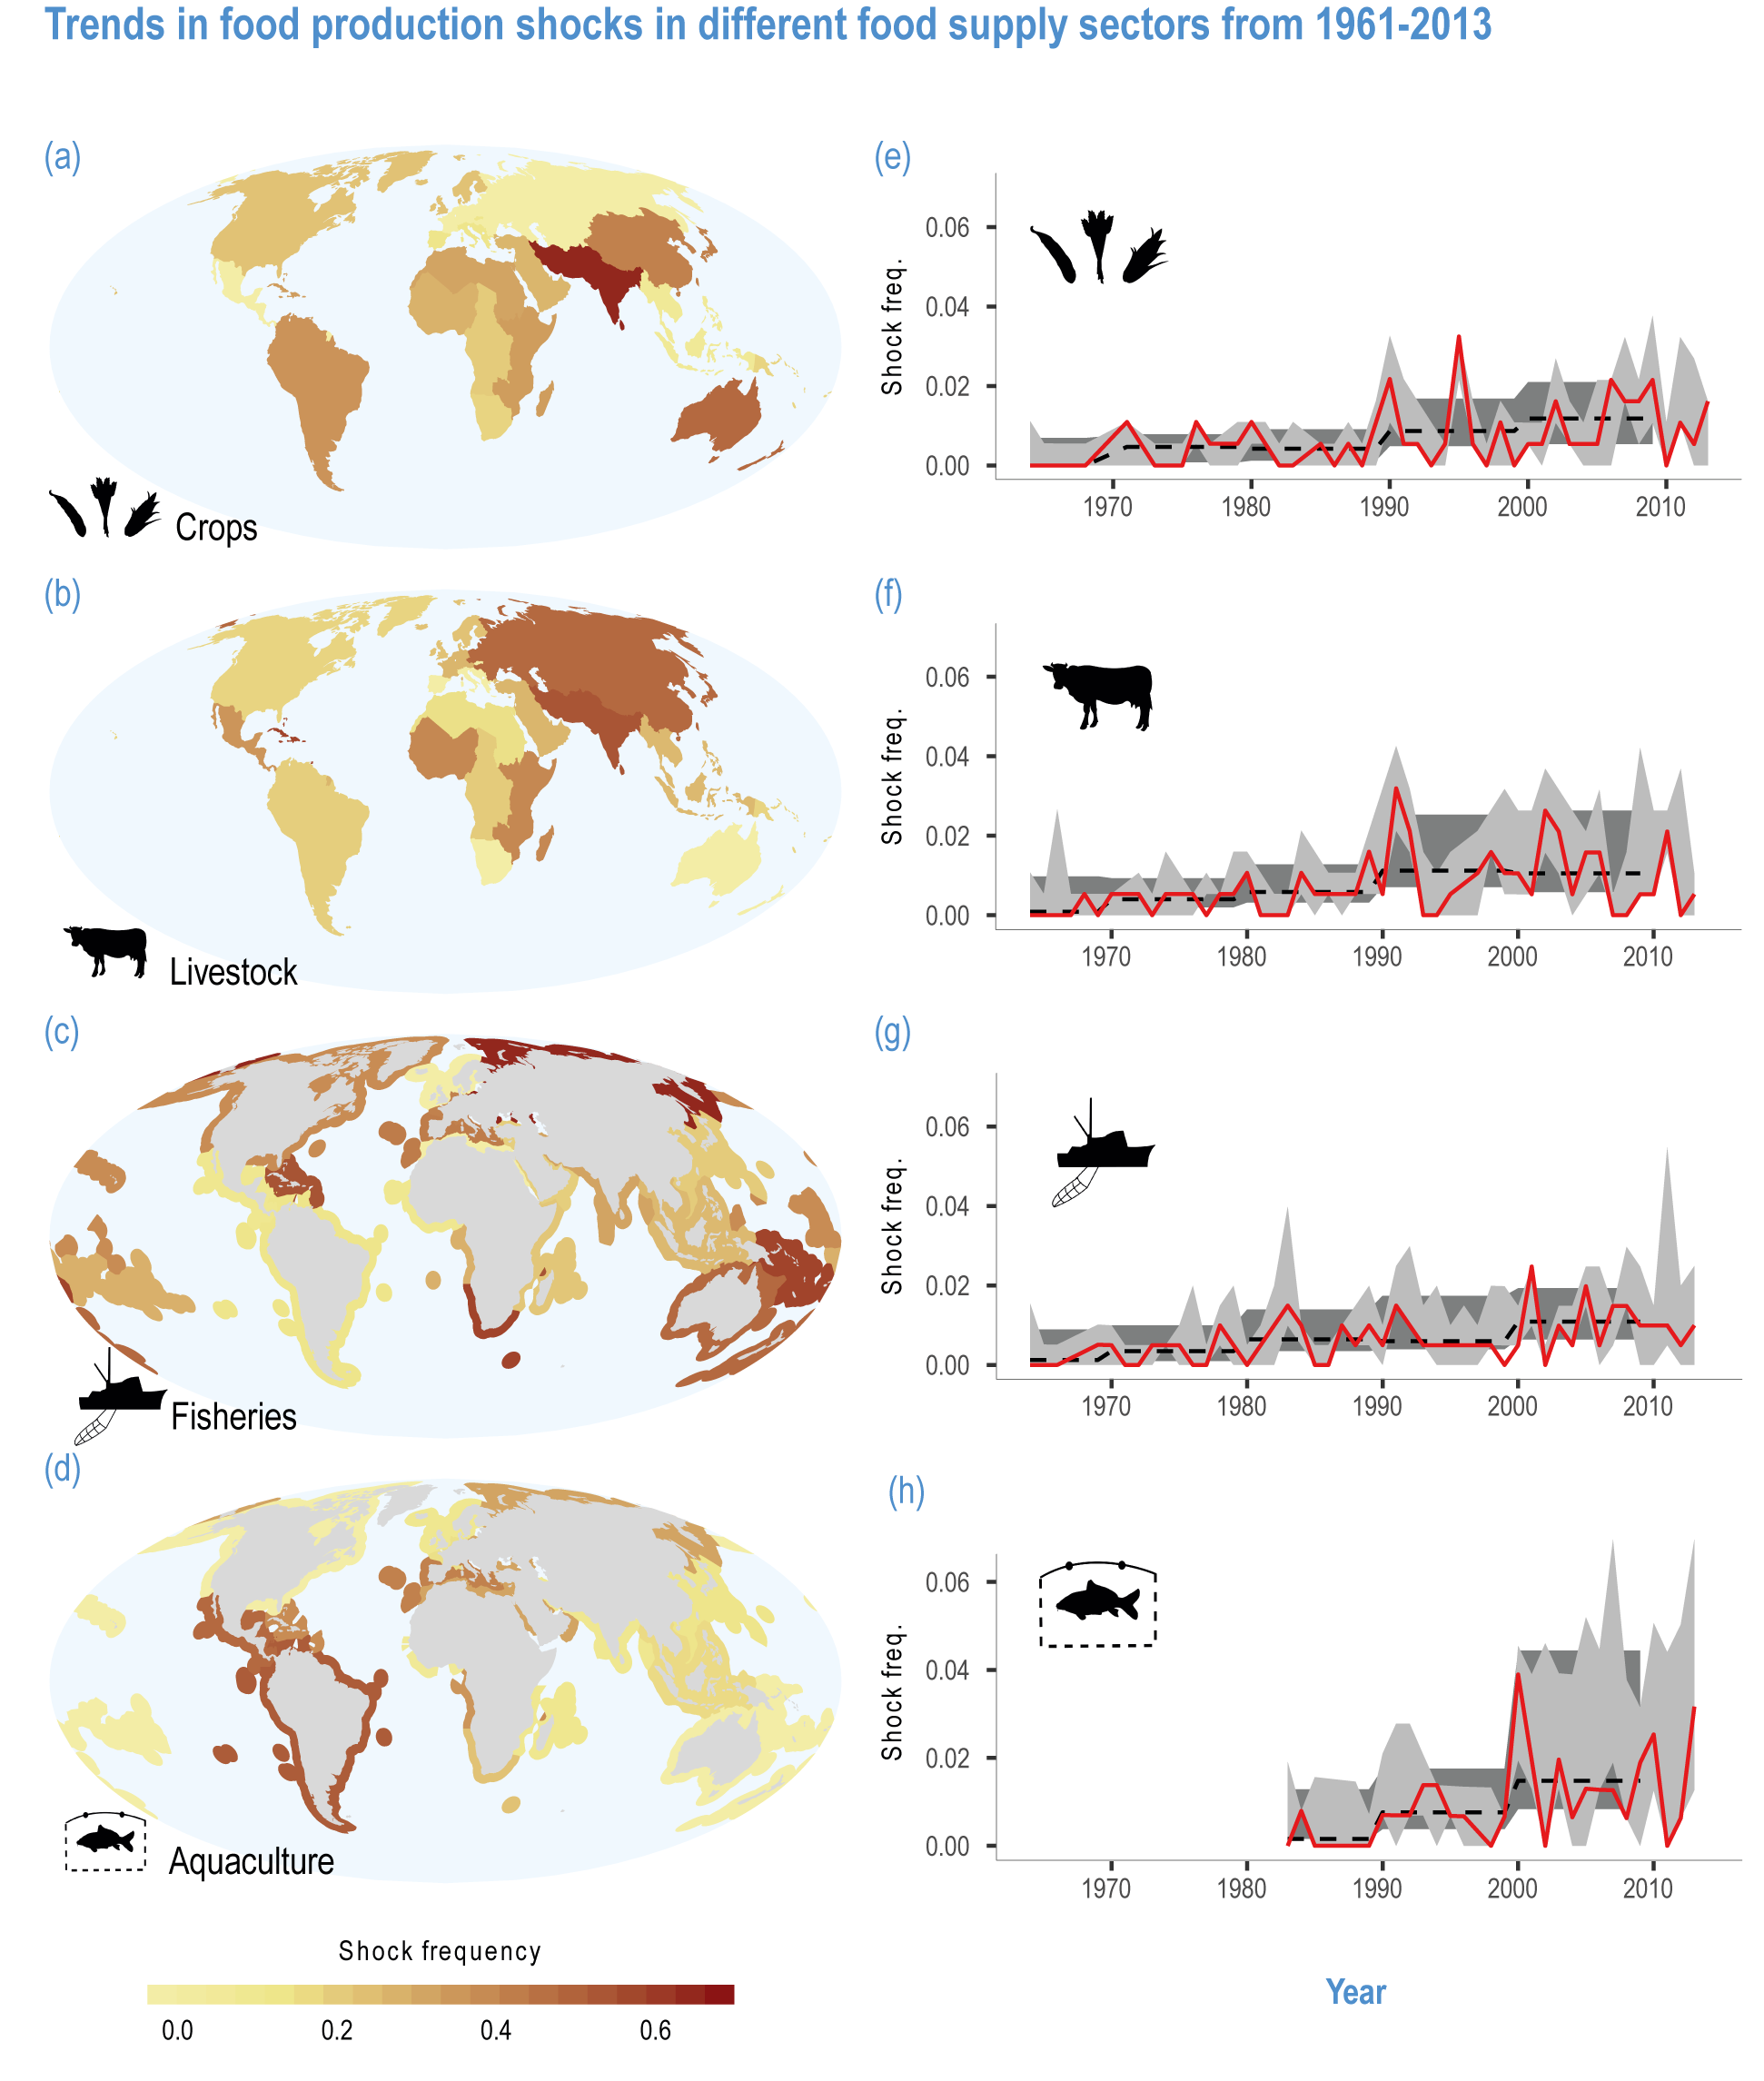
Figure FAQ5.1.1 |
Trends in food production shocks in different food supply sectors from 1961 to 2013 (Cottrell et al.
, 2019).
The red lines in the time series are the annual shock frequency, and the dashed line is the decadal mean.