Back chapter figures
Figure 6.3
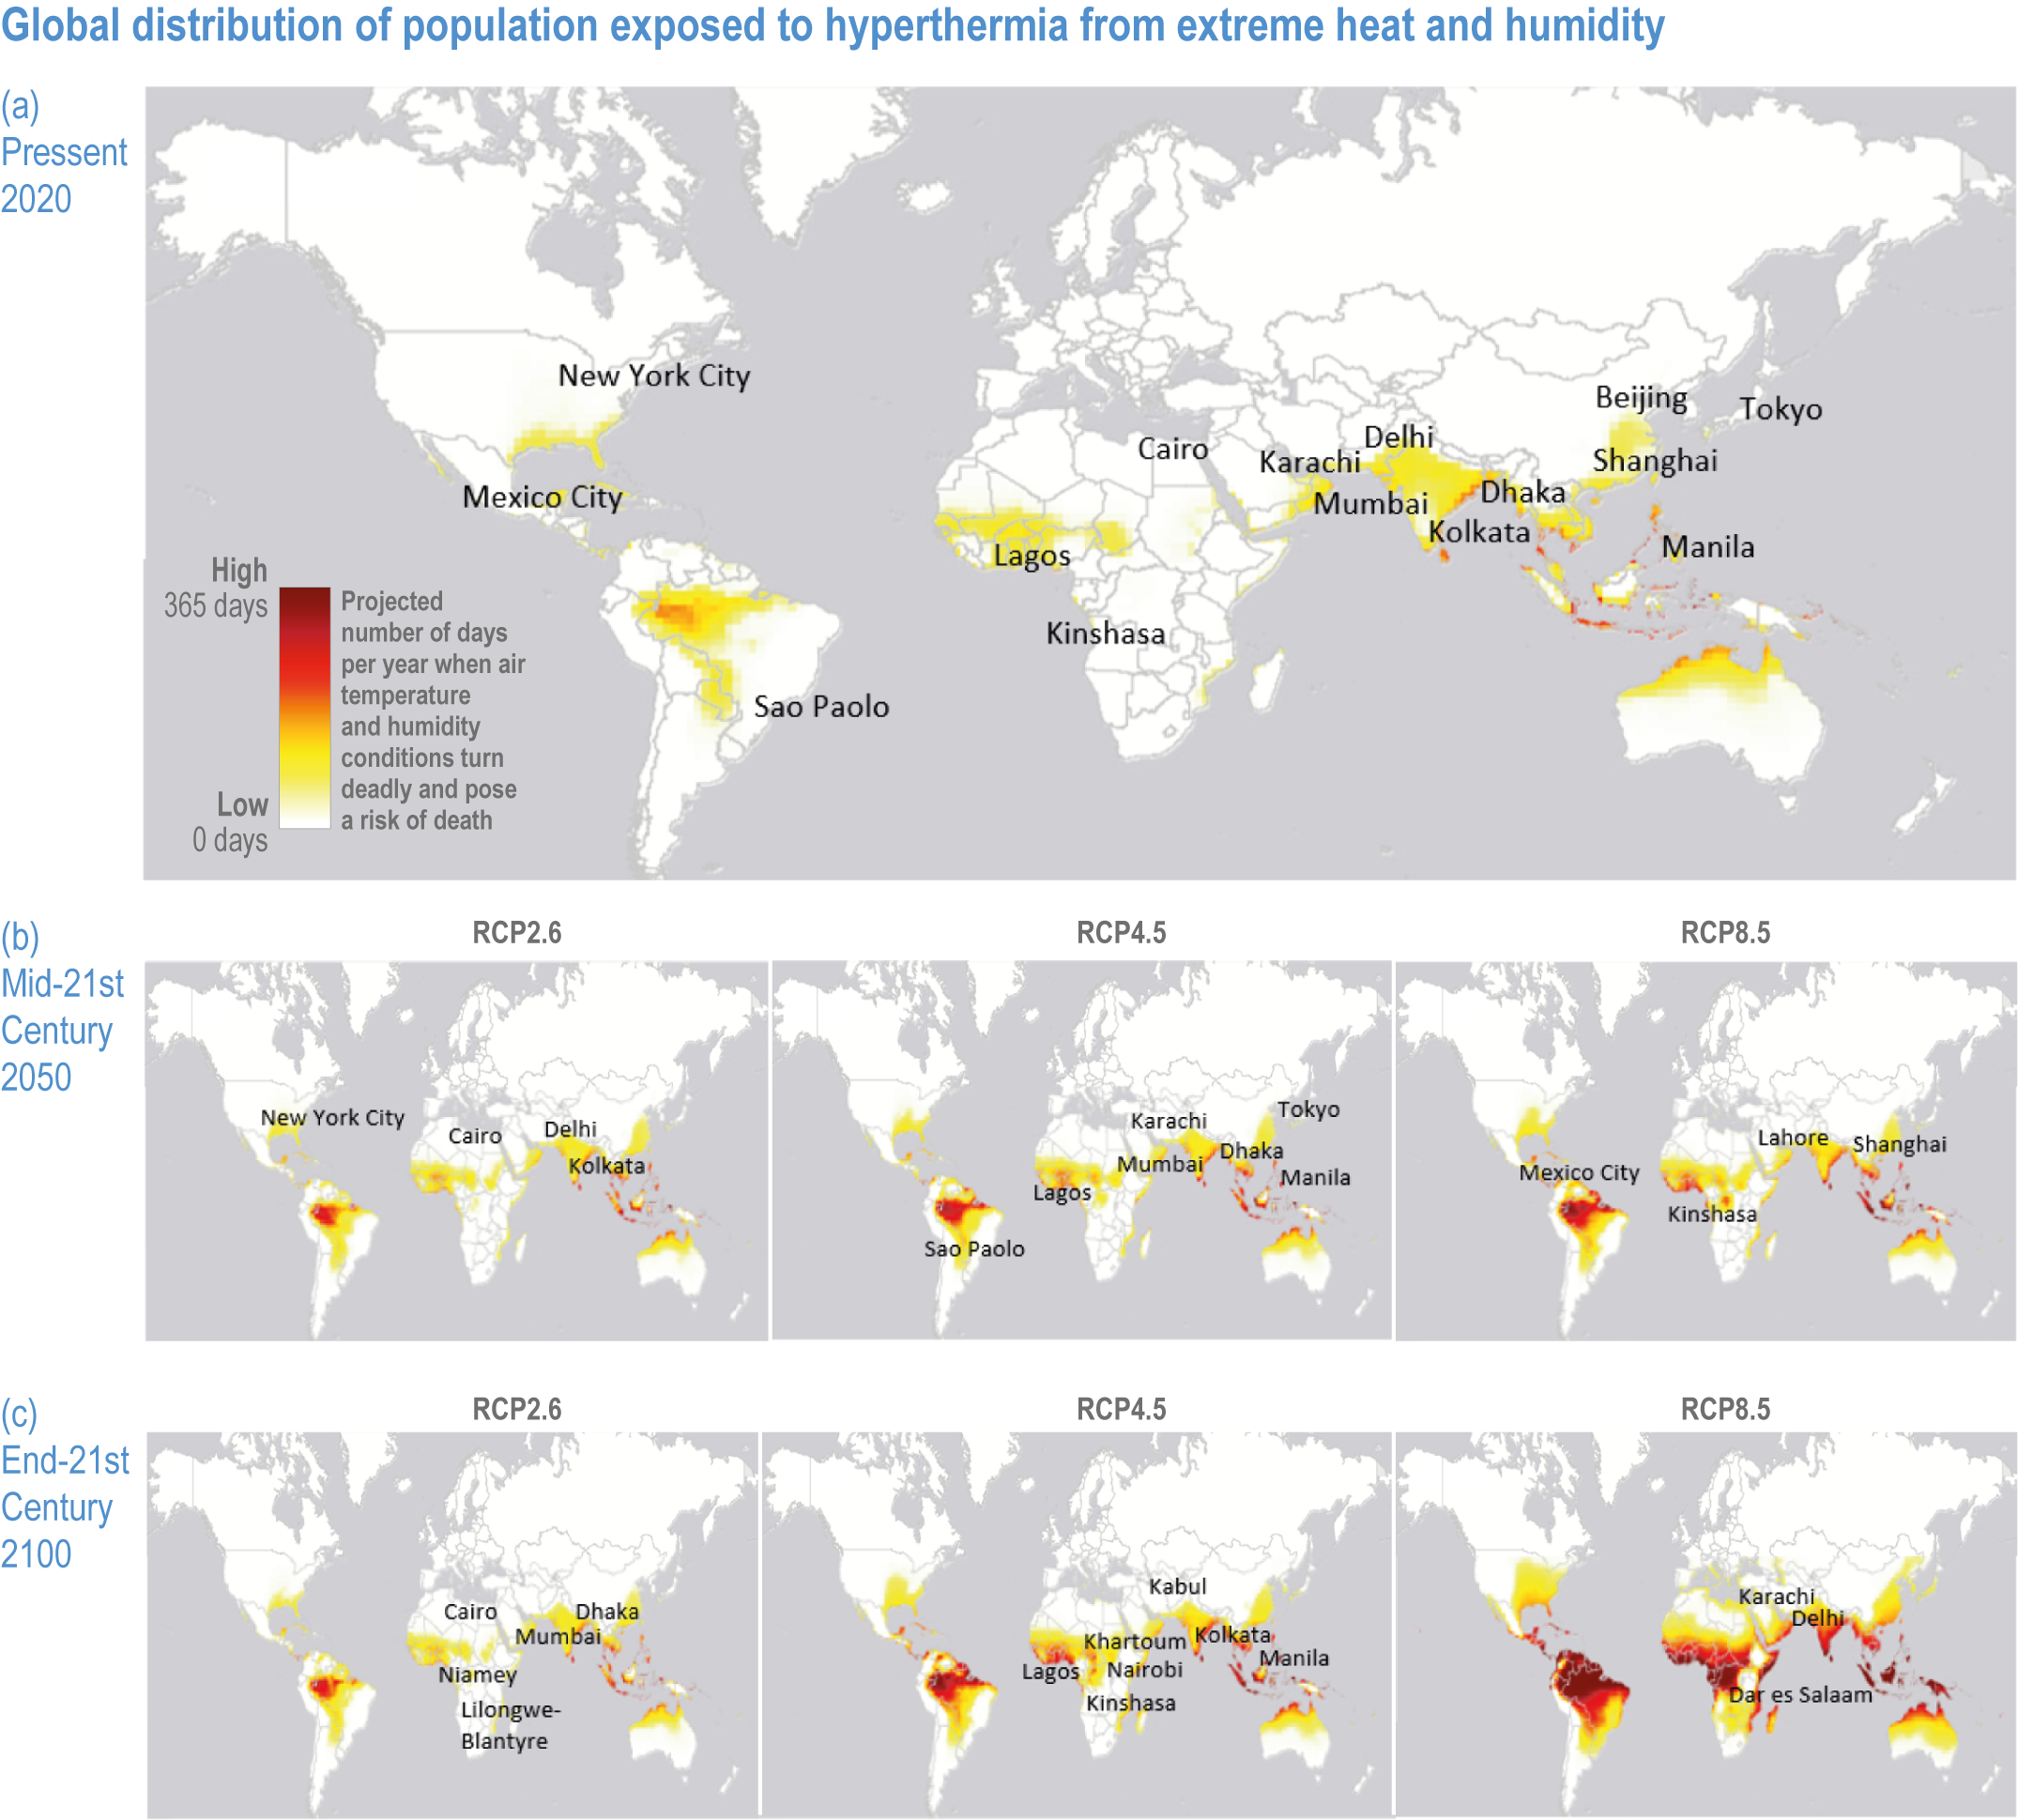
Figure caption
Figure 6.3 | Global distribution of population exposed to hyperthermia from extreme heat for (a) the present, and projections from selected Representative Concentration Pathways in (b) the mid-21st century and (c) the end of the 21st century. Shading indicates projected number of days in a year in which conditions of air temperature and humidity surpass a common threshold beyond which climate conditions turned deadly and pose a risk of death (Mora et al., 2017). Named cities are the top 15 urban areas by population size during 2020, 2050 and 2100, respectively, as projected by Hoornweg and Pope (2017)