Figure 6.4
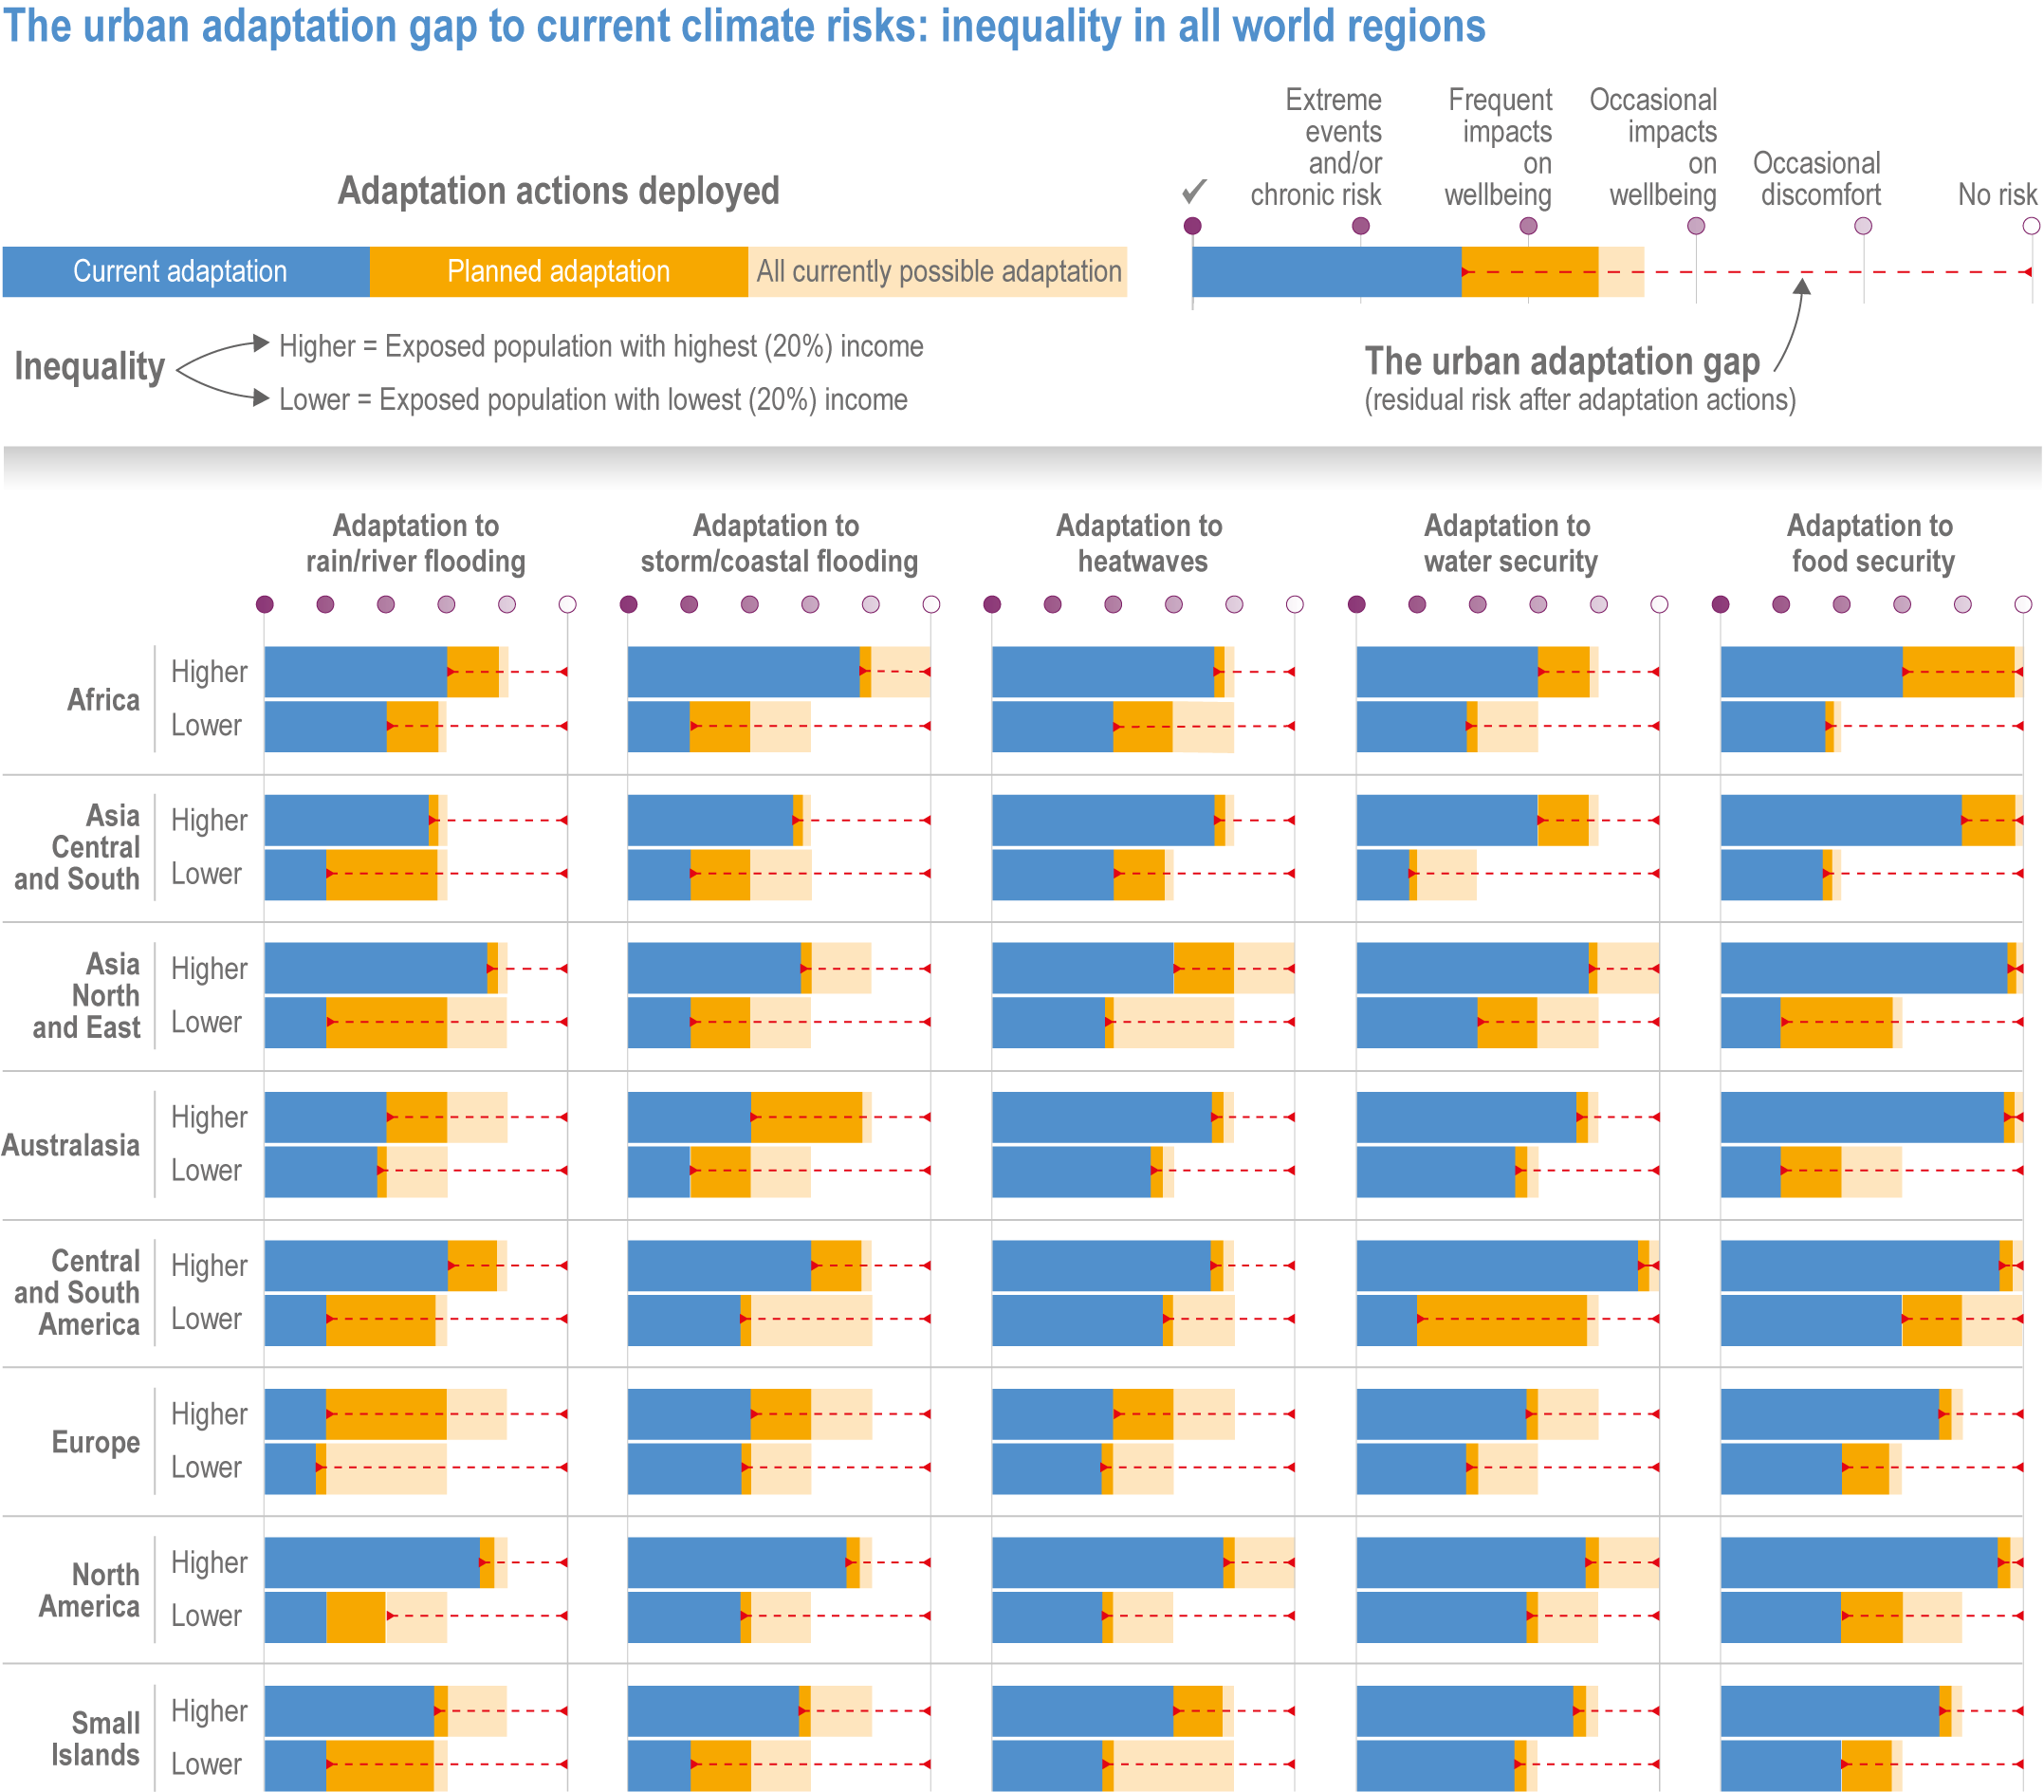
Figure caption
Figure 6.4 | The Urban Adaptation Gap. This is a qualitative assessment presenting individual, non-comparative data for world regions from 25 AR6 Coordinating Lead Authors (CLAs) and Lead Authors (LAs), the majority from regional chapters. Respondents were asked to make expert summary statements based on the data included within their chapters and across the AR6 report augmented by their expert knowledge. Multiple iterations allowed opportunity for individual and group judgement. Urban populations and risks are very diverse within regions making the presented results indicative only. Variability in data coverage leads to the overall analysis having medium agreement, medium evidence. Major trends identified in 6.3.1 at least meet this level of confidence. Analysis is presented for current observed climate change associated hazards and for three adaptation scenarios: (1) current adaptation (based on current levels of risk management and climate adaptation), (2) planned adaptation (assessing the level of adaptation that could be realised if all national, city and neighbourhood plans and policies were fully enacted), (3) transformative adaptation (if all possible adaptation measures were to be enacted). Assessments were made for the lowest and highest quintile by income. Residual risk levels achieved for each income class under each adaptation scenario are indicated by five adaptation levels: no risk, occasional discomfort, occasional impacts on well-being, frequent impacts on well-being, extreme events and/or chronic risk. The urban adaptation gap is revealed when levels of achieved adaptation fall short of delivering ‘no risk’. The graphic uses IPCC Regions, and has split Asia into two regions: North and East Asia, and Central and South Asia. Technical support is acknowledged from Greg Dodds and Sophie Wang