Back chapter figures
Figure 7.7
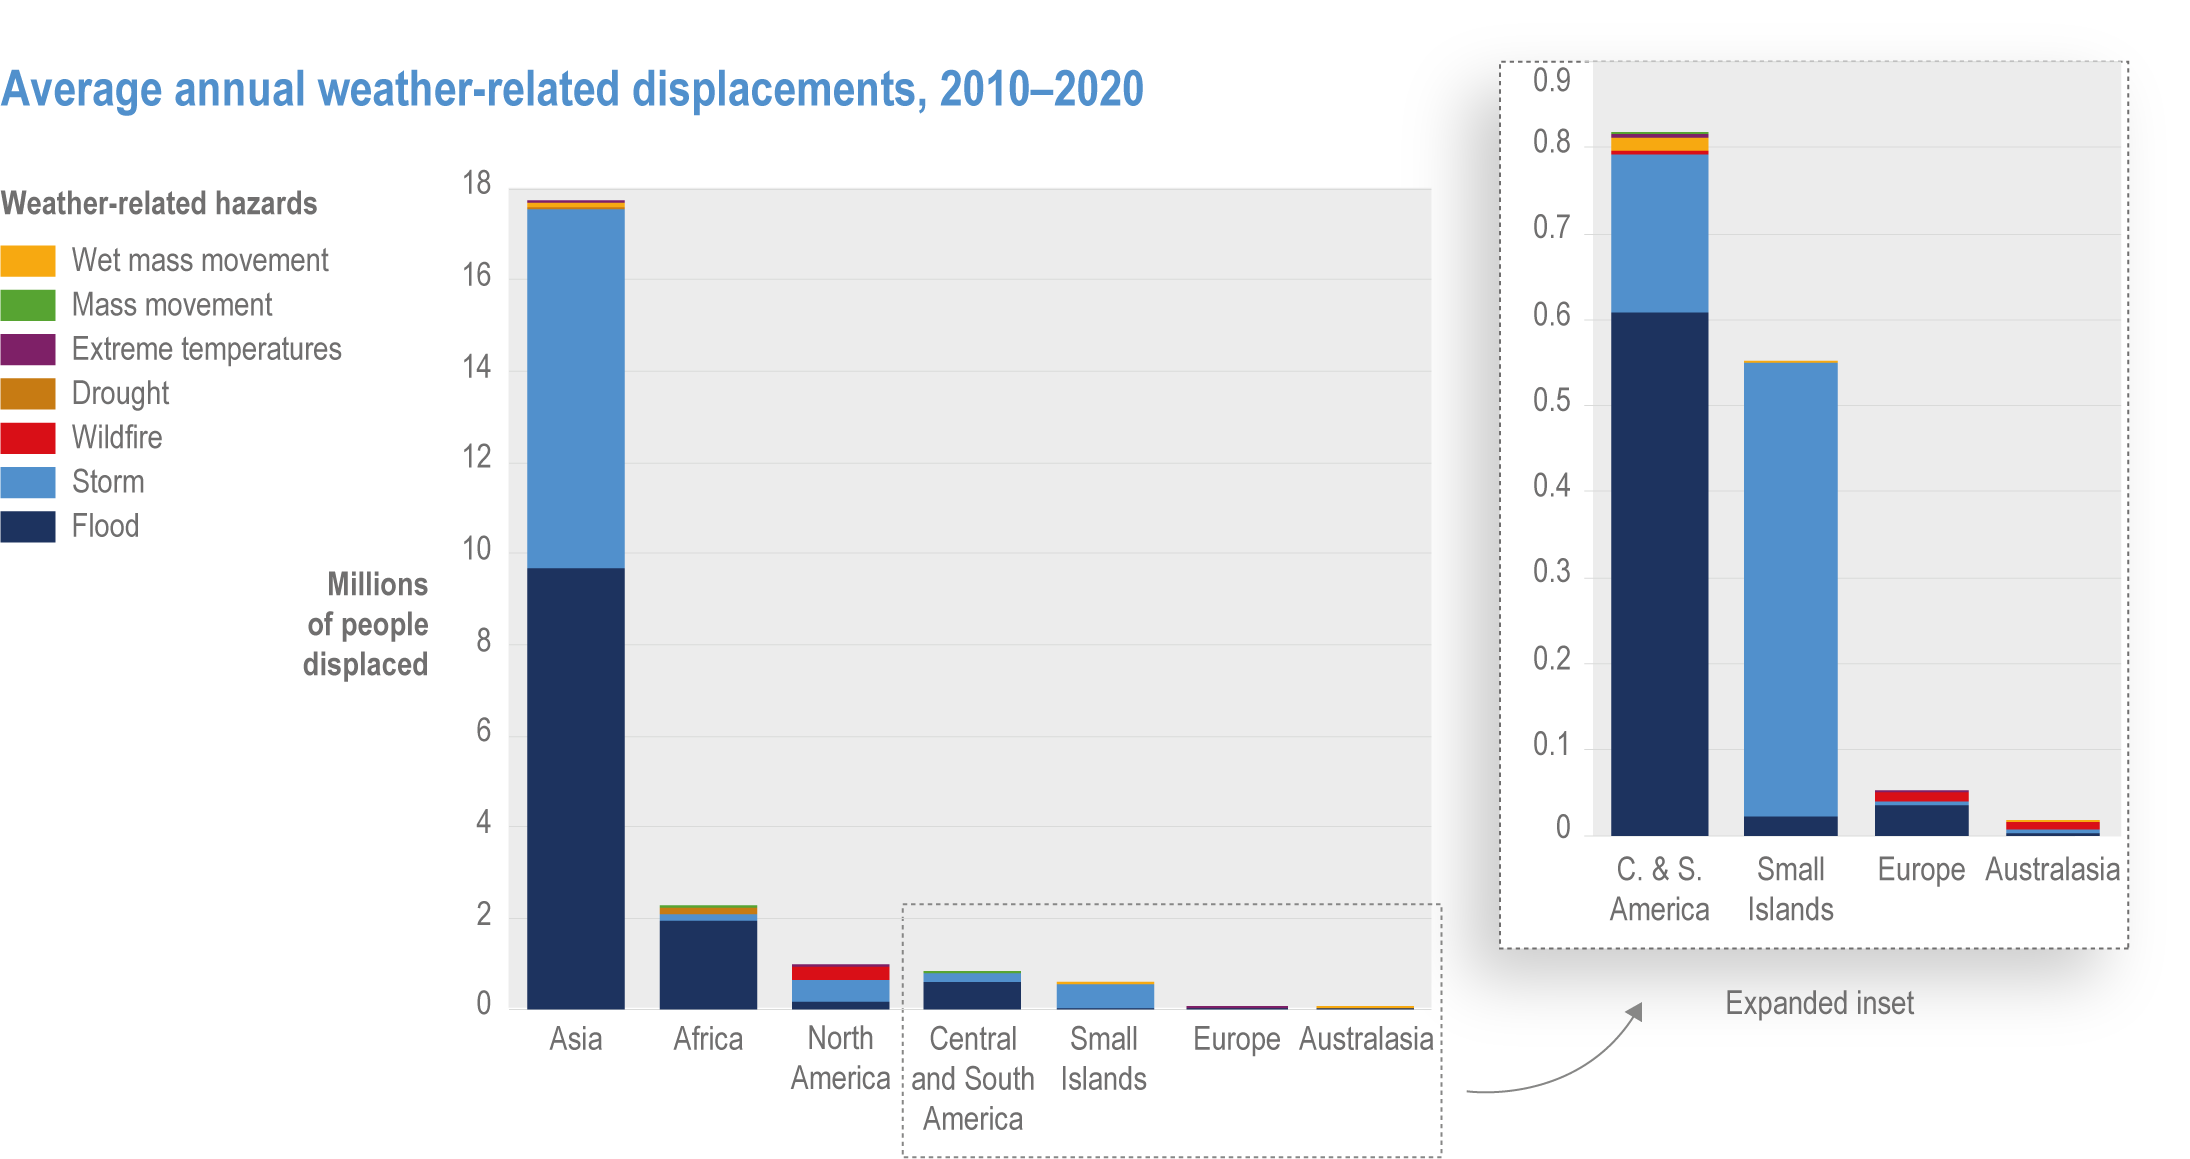
Figure caption
Figure 7.7 | Average number of people displaced annually by selected weather-related events from 2010 to 2020 by region. See text for important notes regarding data collection and trends. Source statistics provided by the Internal Displacement Monitoring Centre (https://www.internal-displacement.org/).