Back chapter figures
Figure 8.5
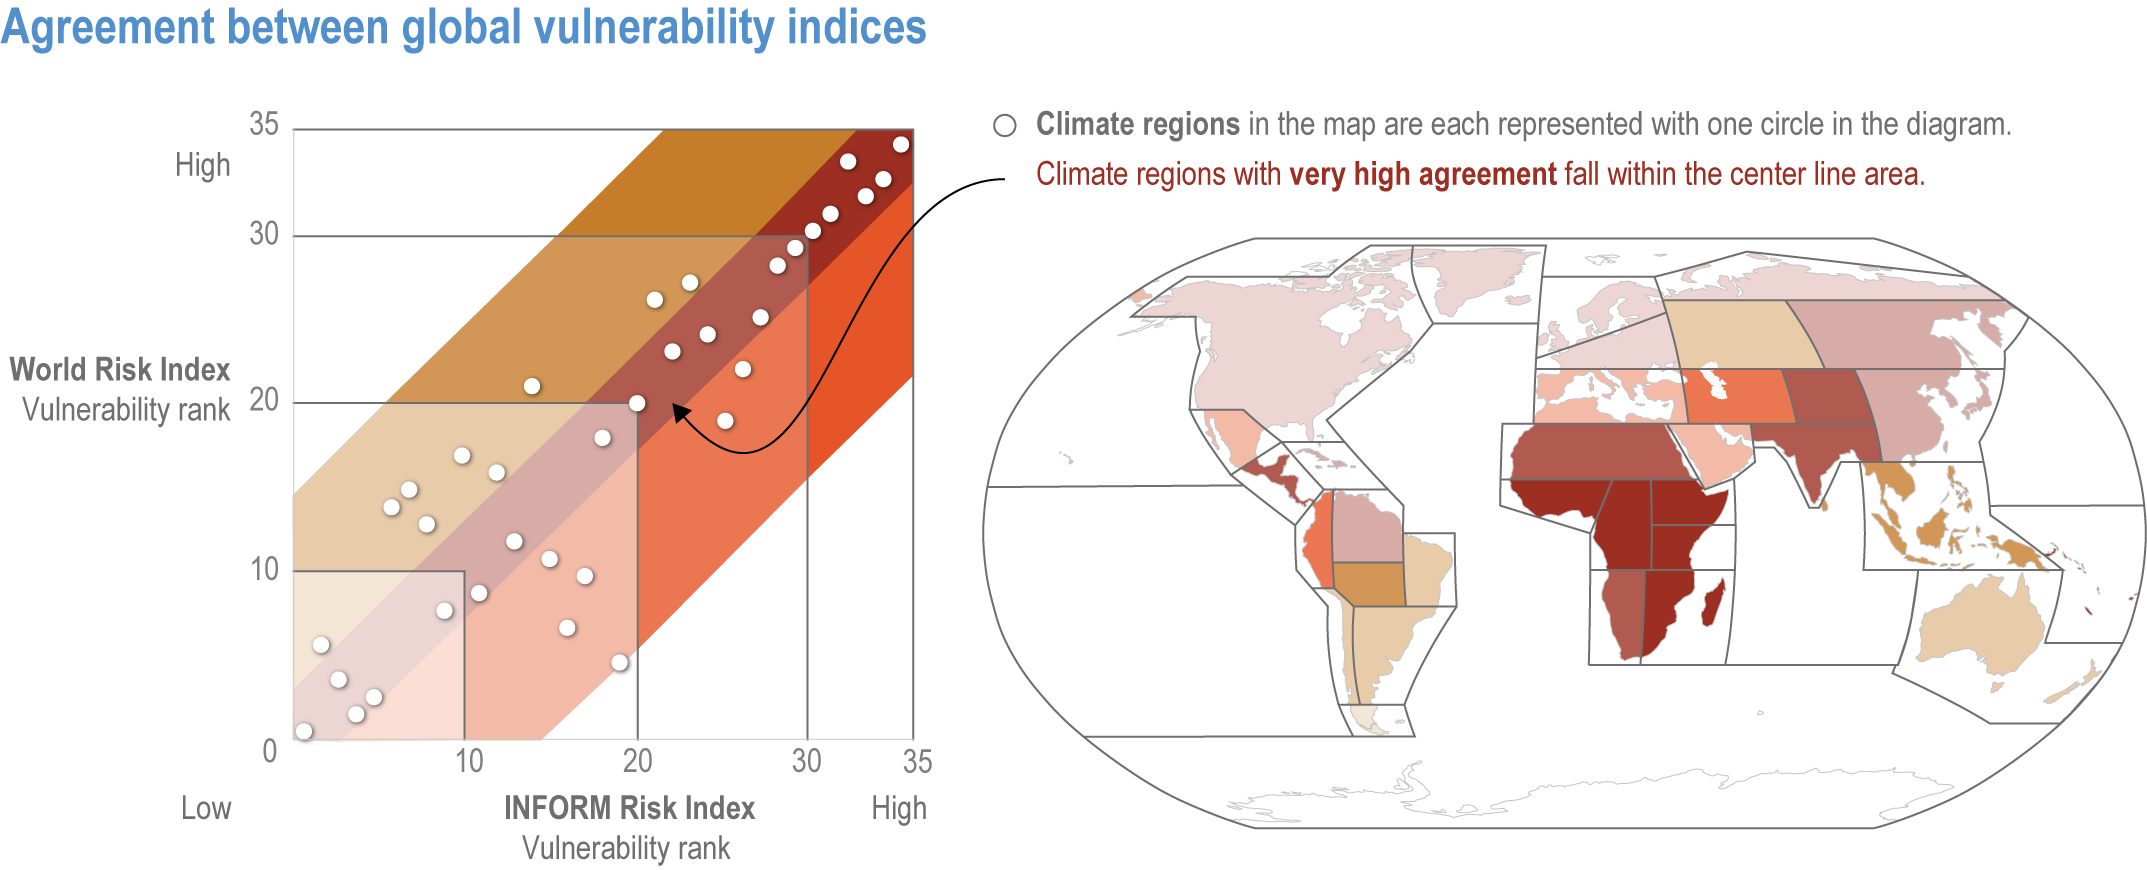
Figure caption
Figure 8.5 | Aggregated vulnerability map at the scale of climate regions based on the averaged ranking of the INFORM Index’s vulnerability component and the averaged ranking of the vulnerability component of the WorldRiskIndex. Based on the rankings of the INFORM index (INFORM, 2019) and the WorldRiskIndex (Birkmann and Welle, 2016; Feldmeyer et al., 2017). The map and diagram show agreement between the two global vulnerability indices when ranking climate regions according to their vulnerability—darker colours show regions of higher vulnerability. The diagram shows how the 35 climate regions are ranked by each index and also serves as a legend for the map above.