Figure 8.7
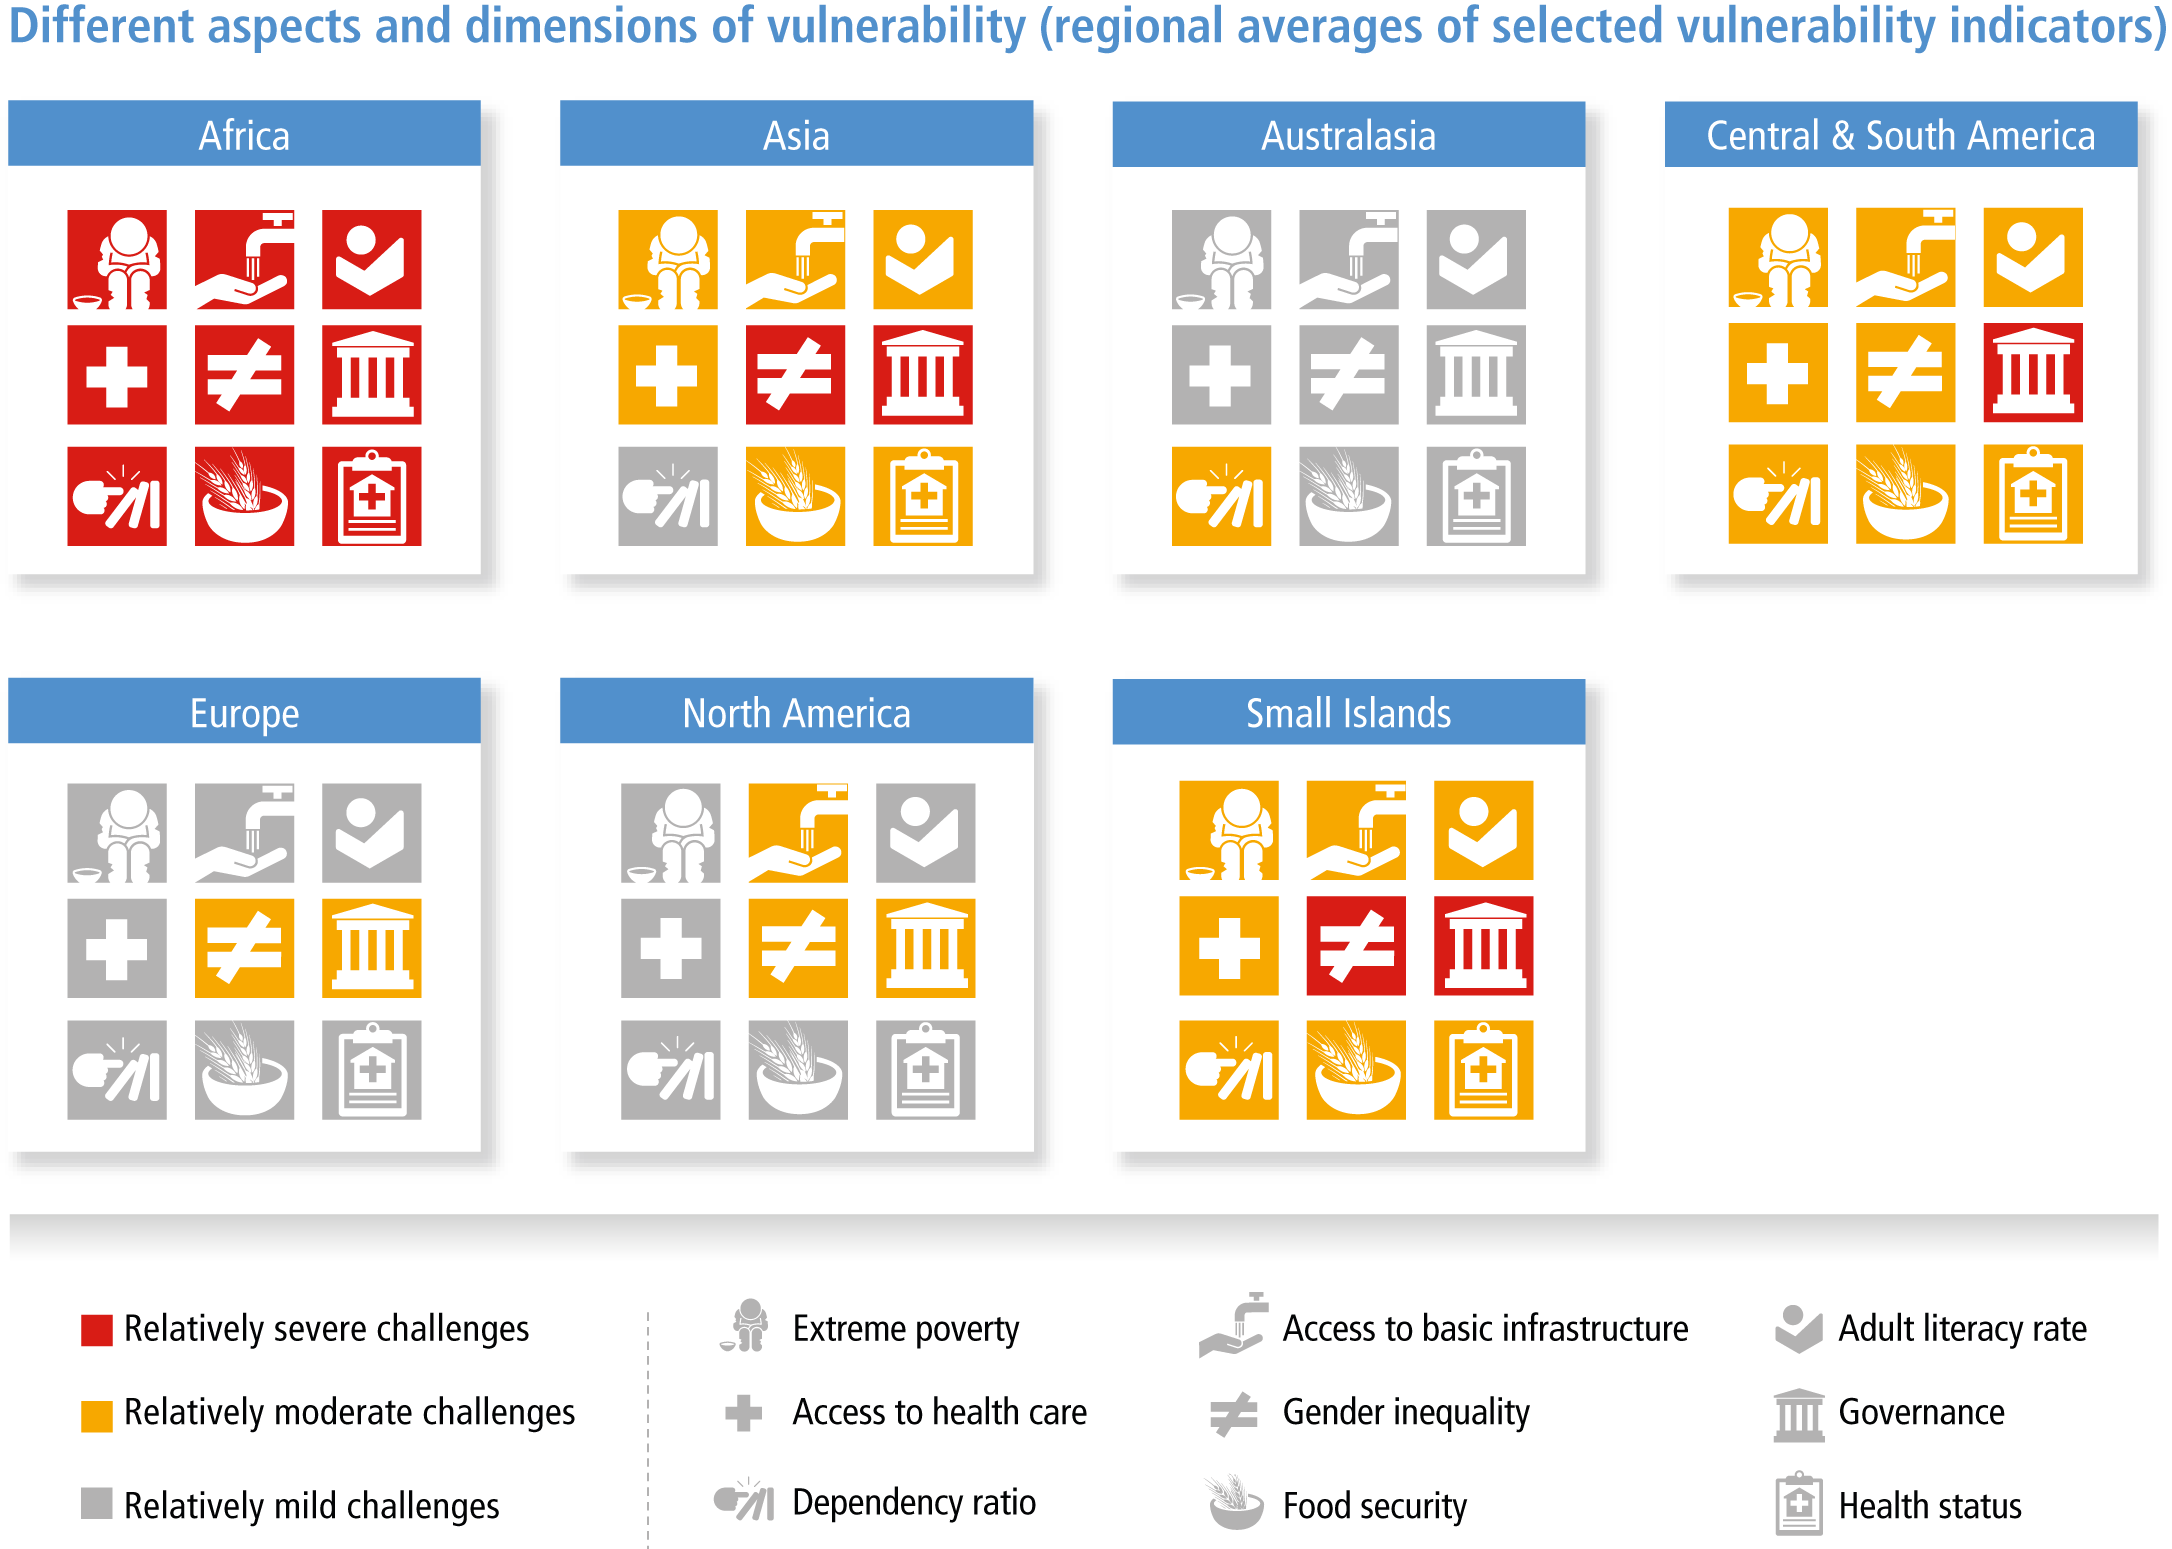
Figure caption
Figure 8.7 | The figure shows selected aspects of human vulnerability, such as extreme poverty and inequality, and access to health care and basic infrastructure as regional averages. These vulnerability aspects are a selection of indicators from the indicator systems (the INFORM Risk Index and WorldRiskIndex 2019) used for the global vulnerability map (Figure 8.6). These normalized indicator scores were averaged for each region and classified into three levels of severity using the natural breaks method. This figure provides a more differentiated picture about the various dimensions of vulnerability that different regions and countries face and the severity of such challenges in each region. Such vulnerability challenges increase the risk of severe adverse impacts of climate change and related hazards (Birkmann et al., 2022).