Back chapter figures
Figure 8.8
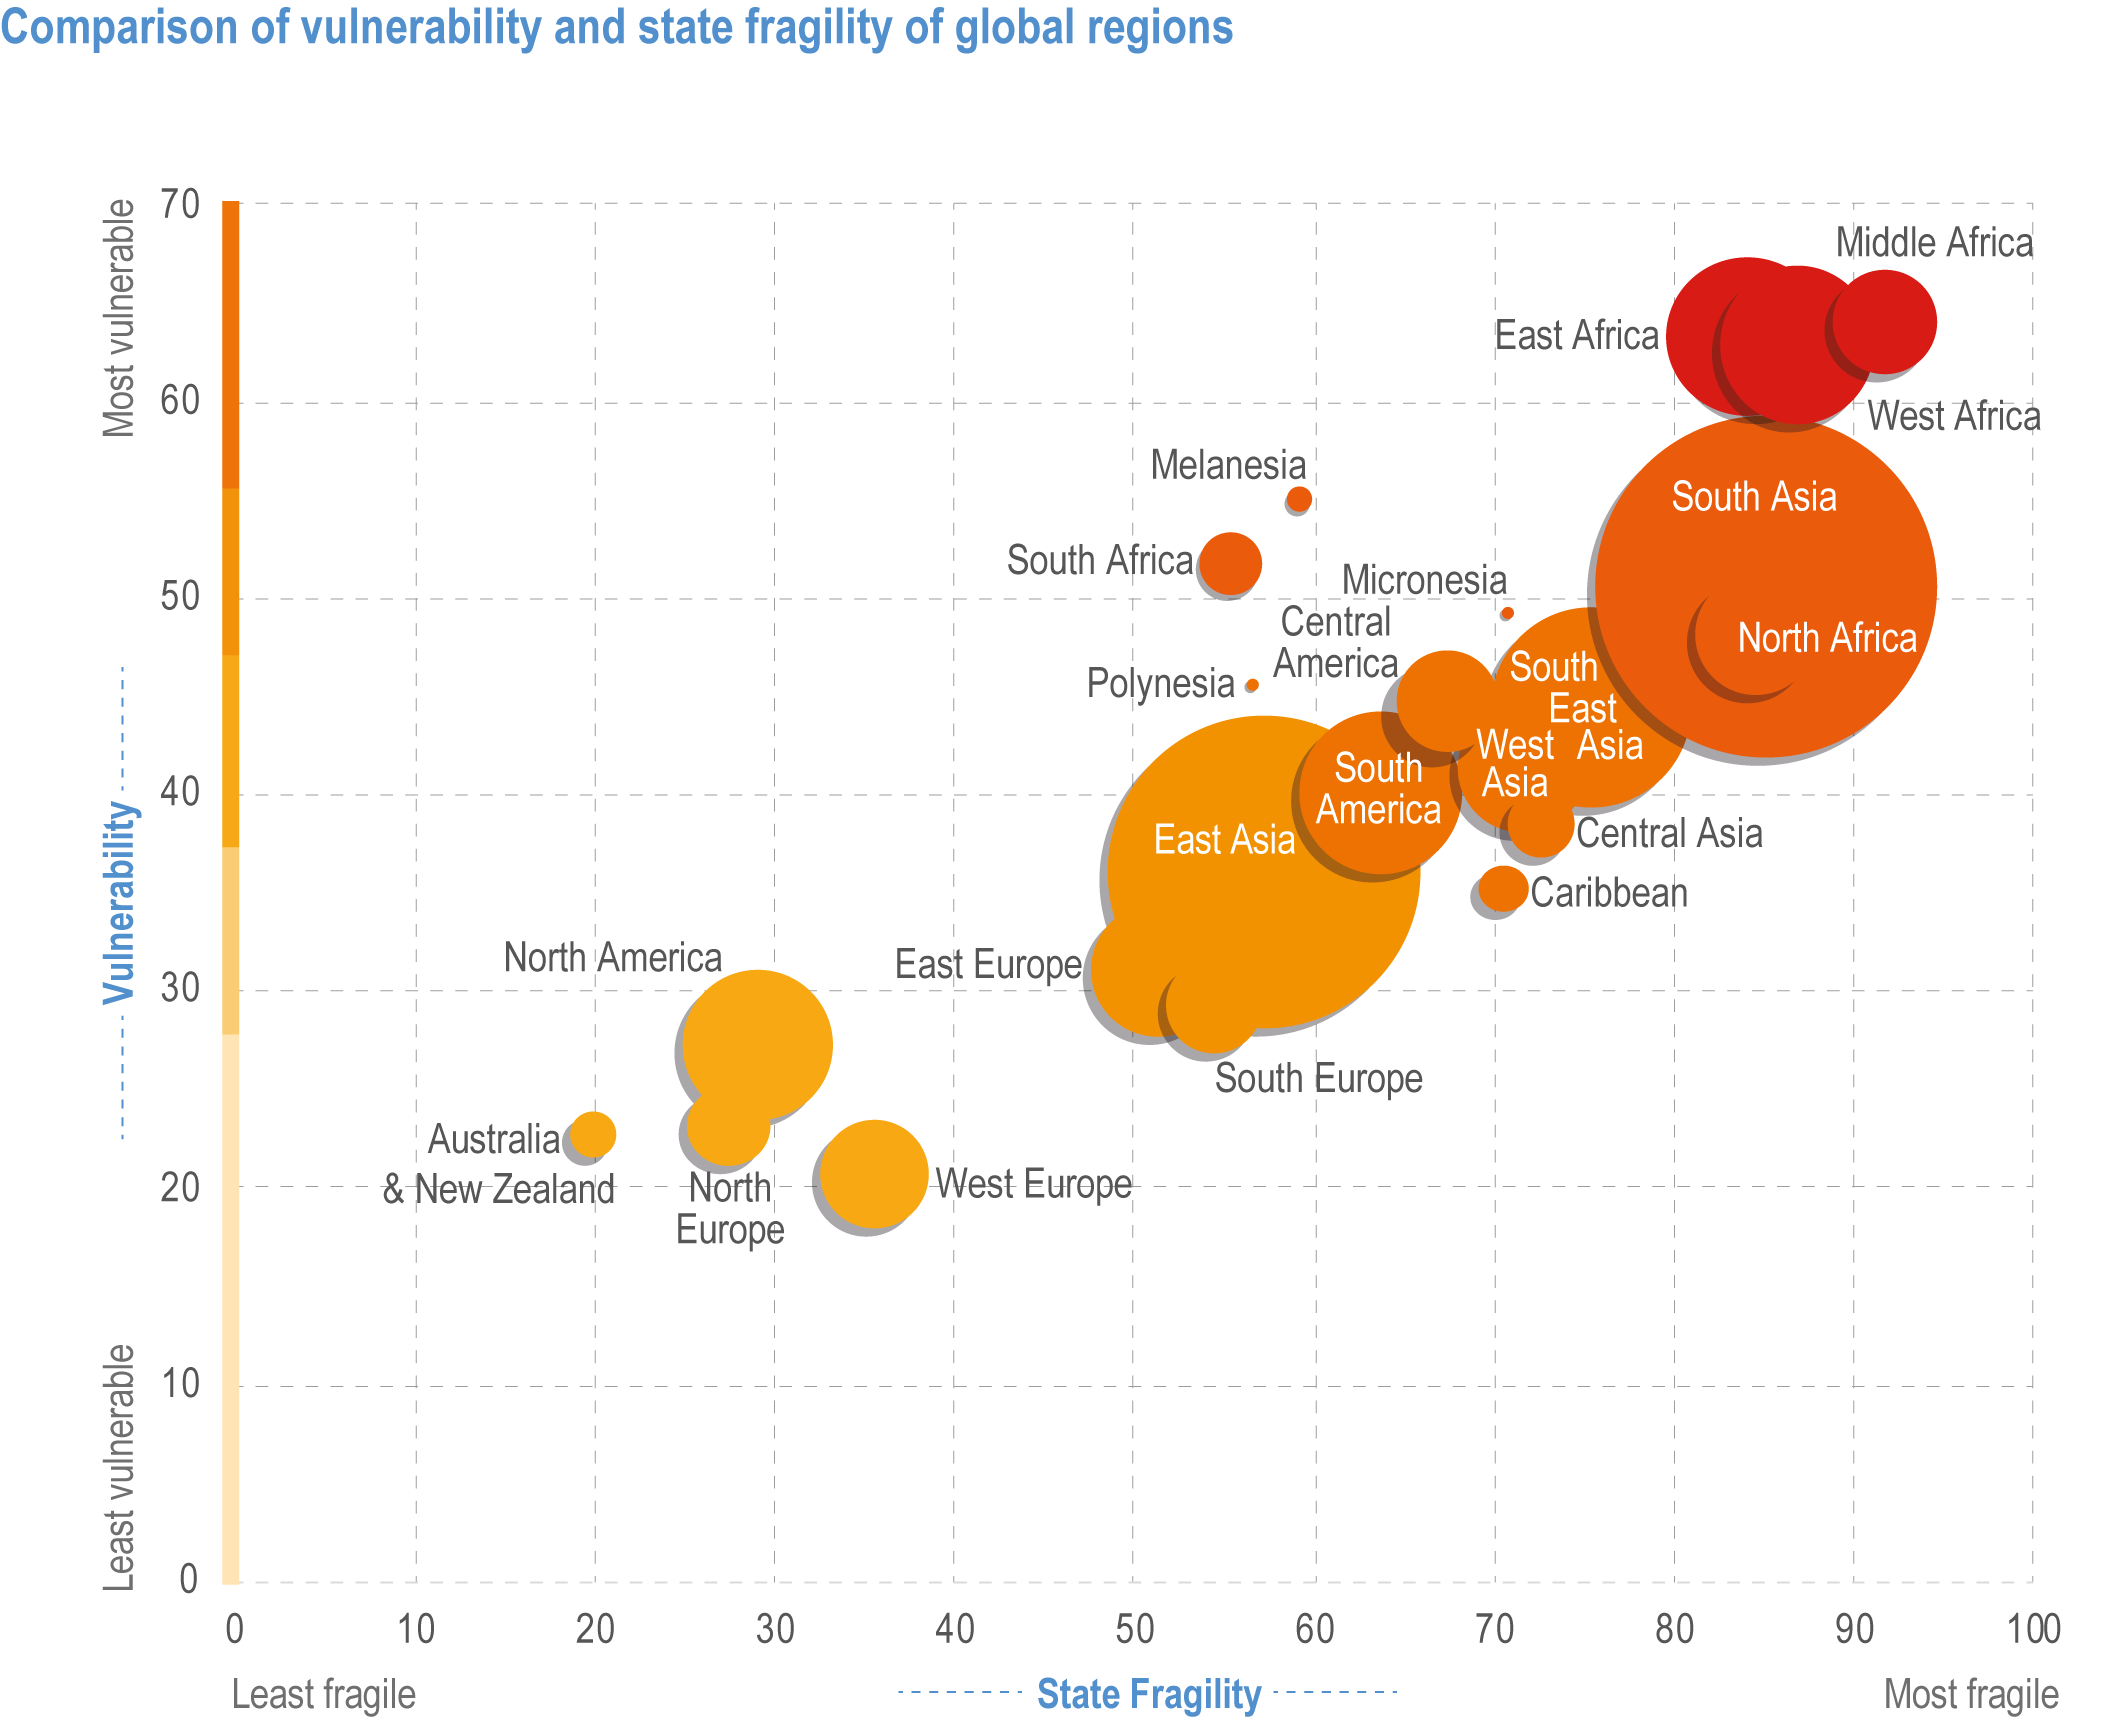
Figure caption
Figure 8.8 | Comparison of the vulnerability and state fragility of global regions. The vulnerability values are the average of the vulnerability component of the WorldRiskIndex 2019 (Birkmann et al., 2021a; Feldmeyer et al., 2021) and the vulnerability and lack of coping capacity components of the INFORM Risk Index 2019 (Marin-Ferrer et al., 2017) classified into five classes using the equal count method (Birkmann et al., 2022). The state fragility values are based on the Fragile States Index 2019 (FFP, 2020) and regions are based on the intermediate and sub-regions of the United Nations Statistical Division. The size of each circle is proportional to the population (World Bank, 2019b) in the respective region.