Back chapter figures
Figure 9.15
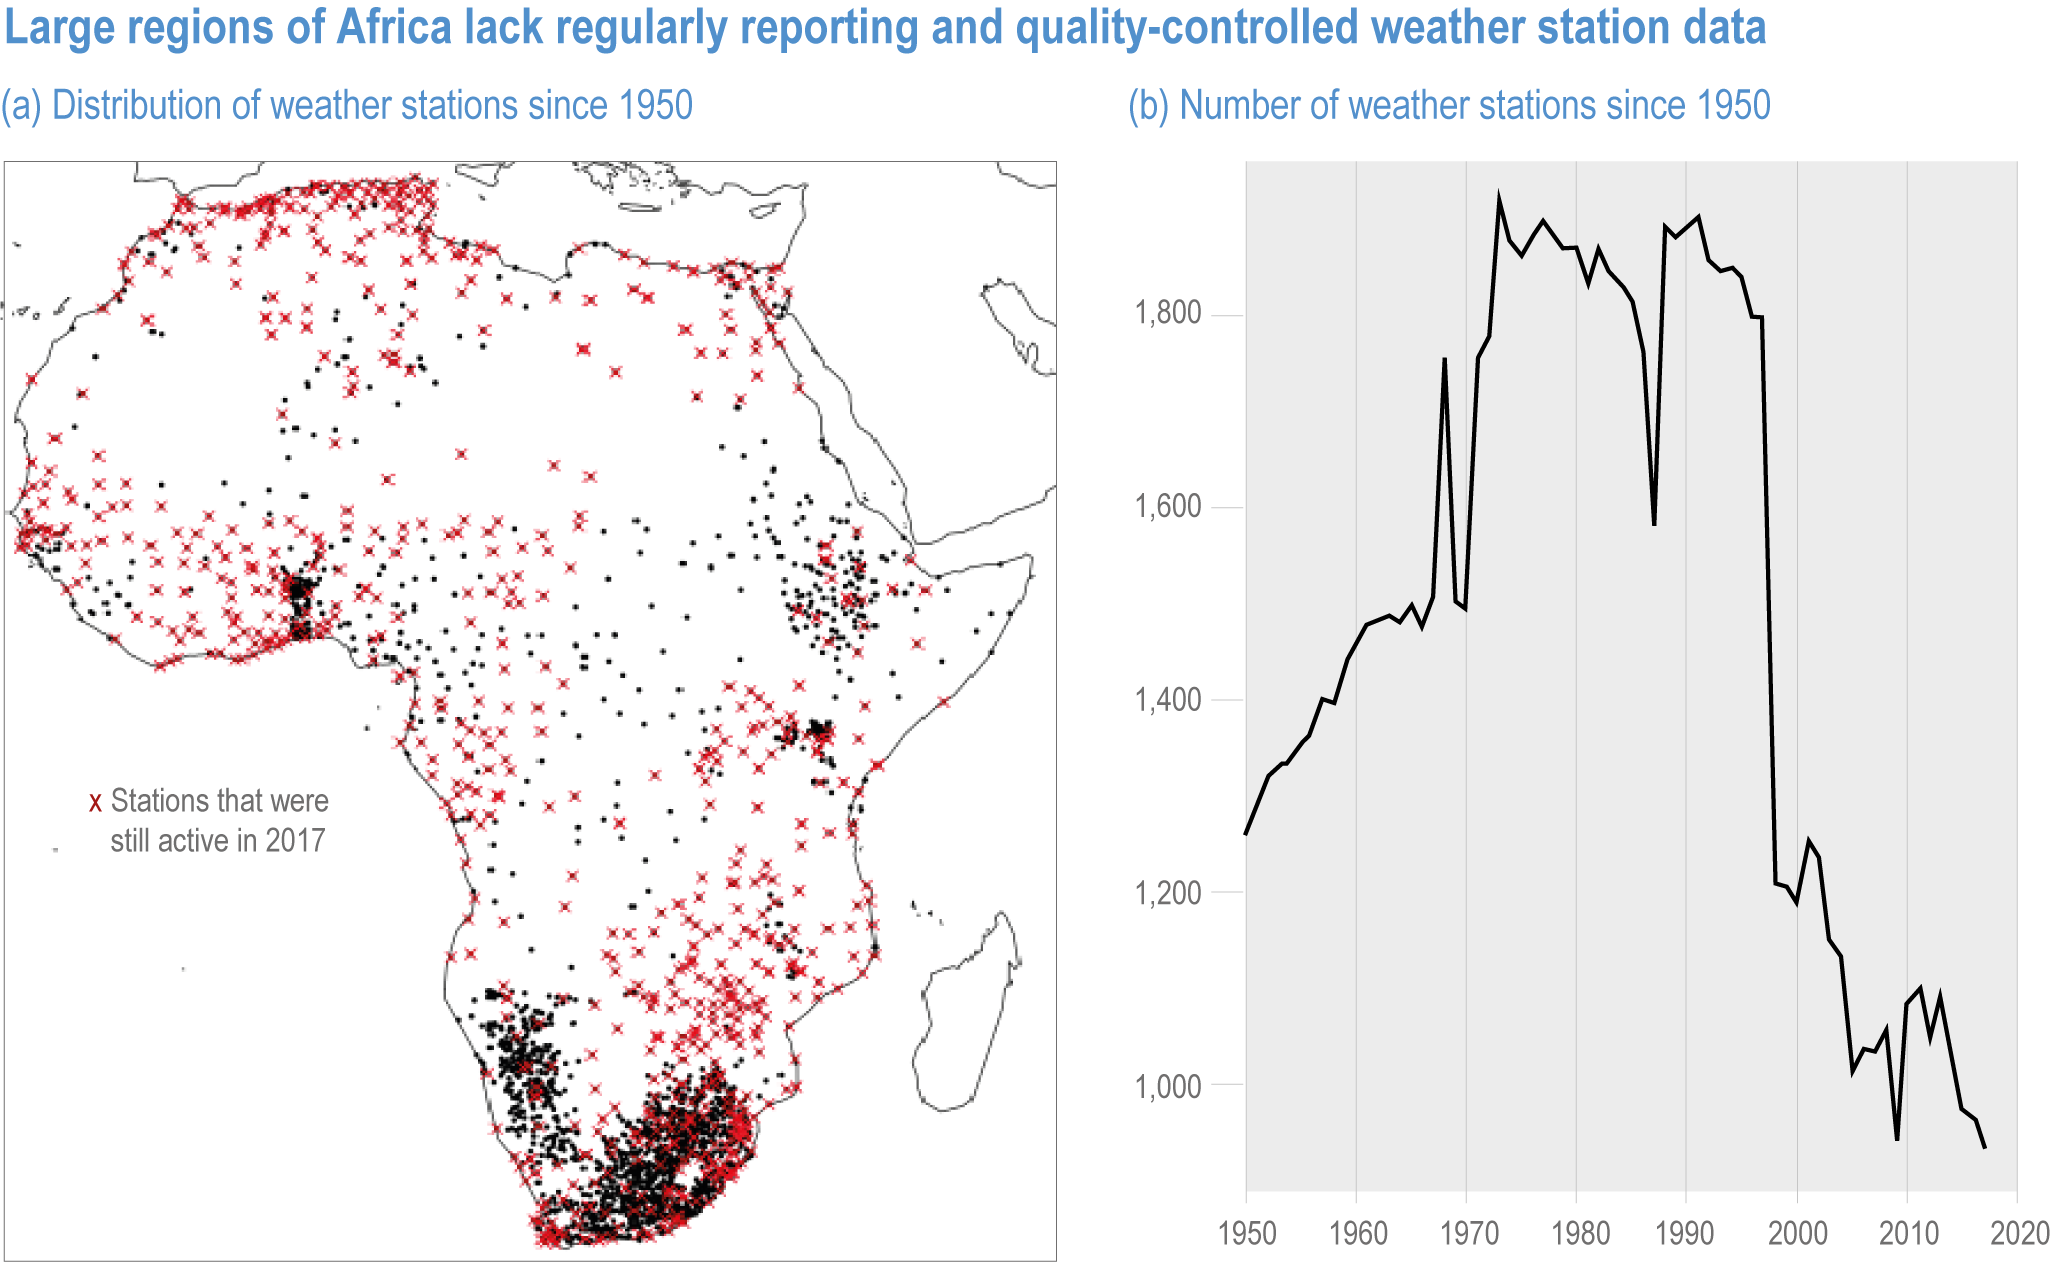
Figure caption
Figure 9.15 | Large regions of Africa lack regularly reporting and quality-controlled weather station data. This figure shows stations in Africa with quality-controlled station data used in developing the Rainfall Estimates on a Gridded Network (REGEN) interpolated rainfall product (Harrison et al., 2019). (a) A spatial representation of stations across the continent since 1950 shown as black dots and red crosses, where red crosses represent stations that were still active in 2017. (b) The decline in operational stations or stations with quality-controlled data since circa1998, which is largely a function of declining networks in a subset of countries. Figure is derived from Carter et al. (2020).