Figure 9.16
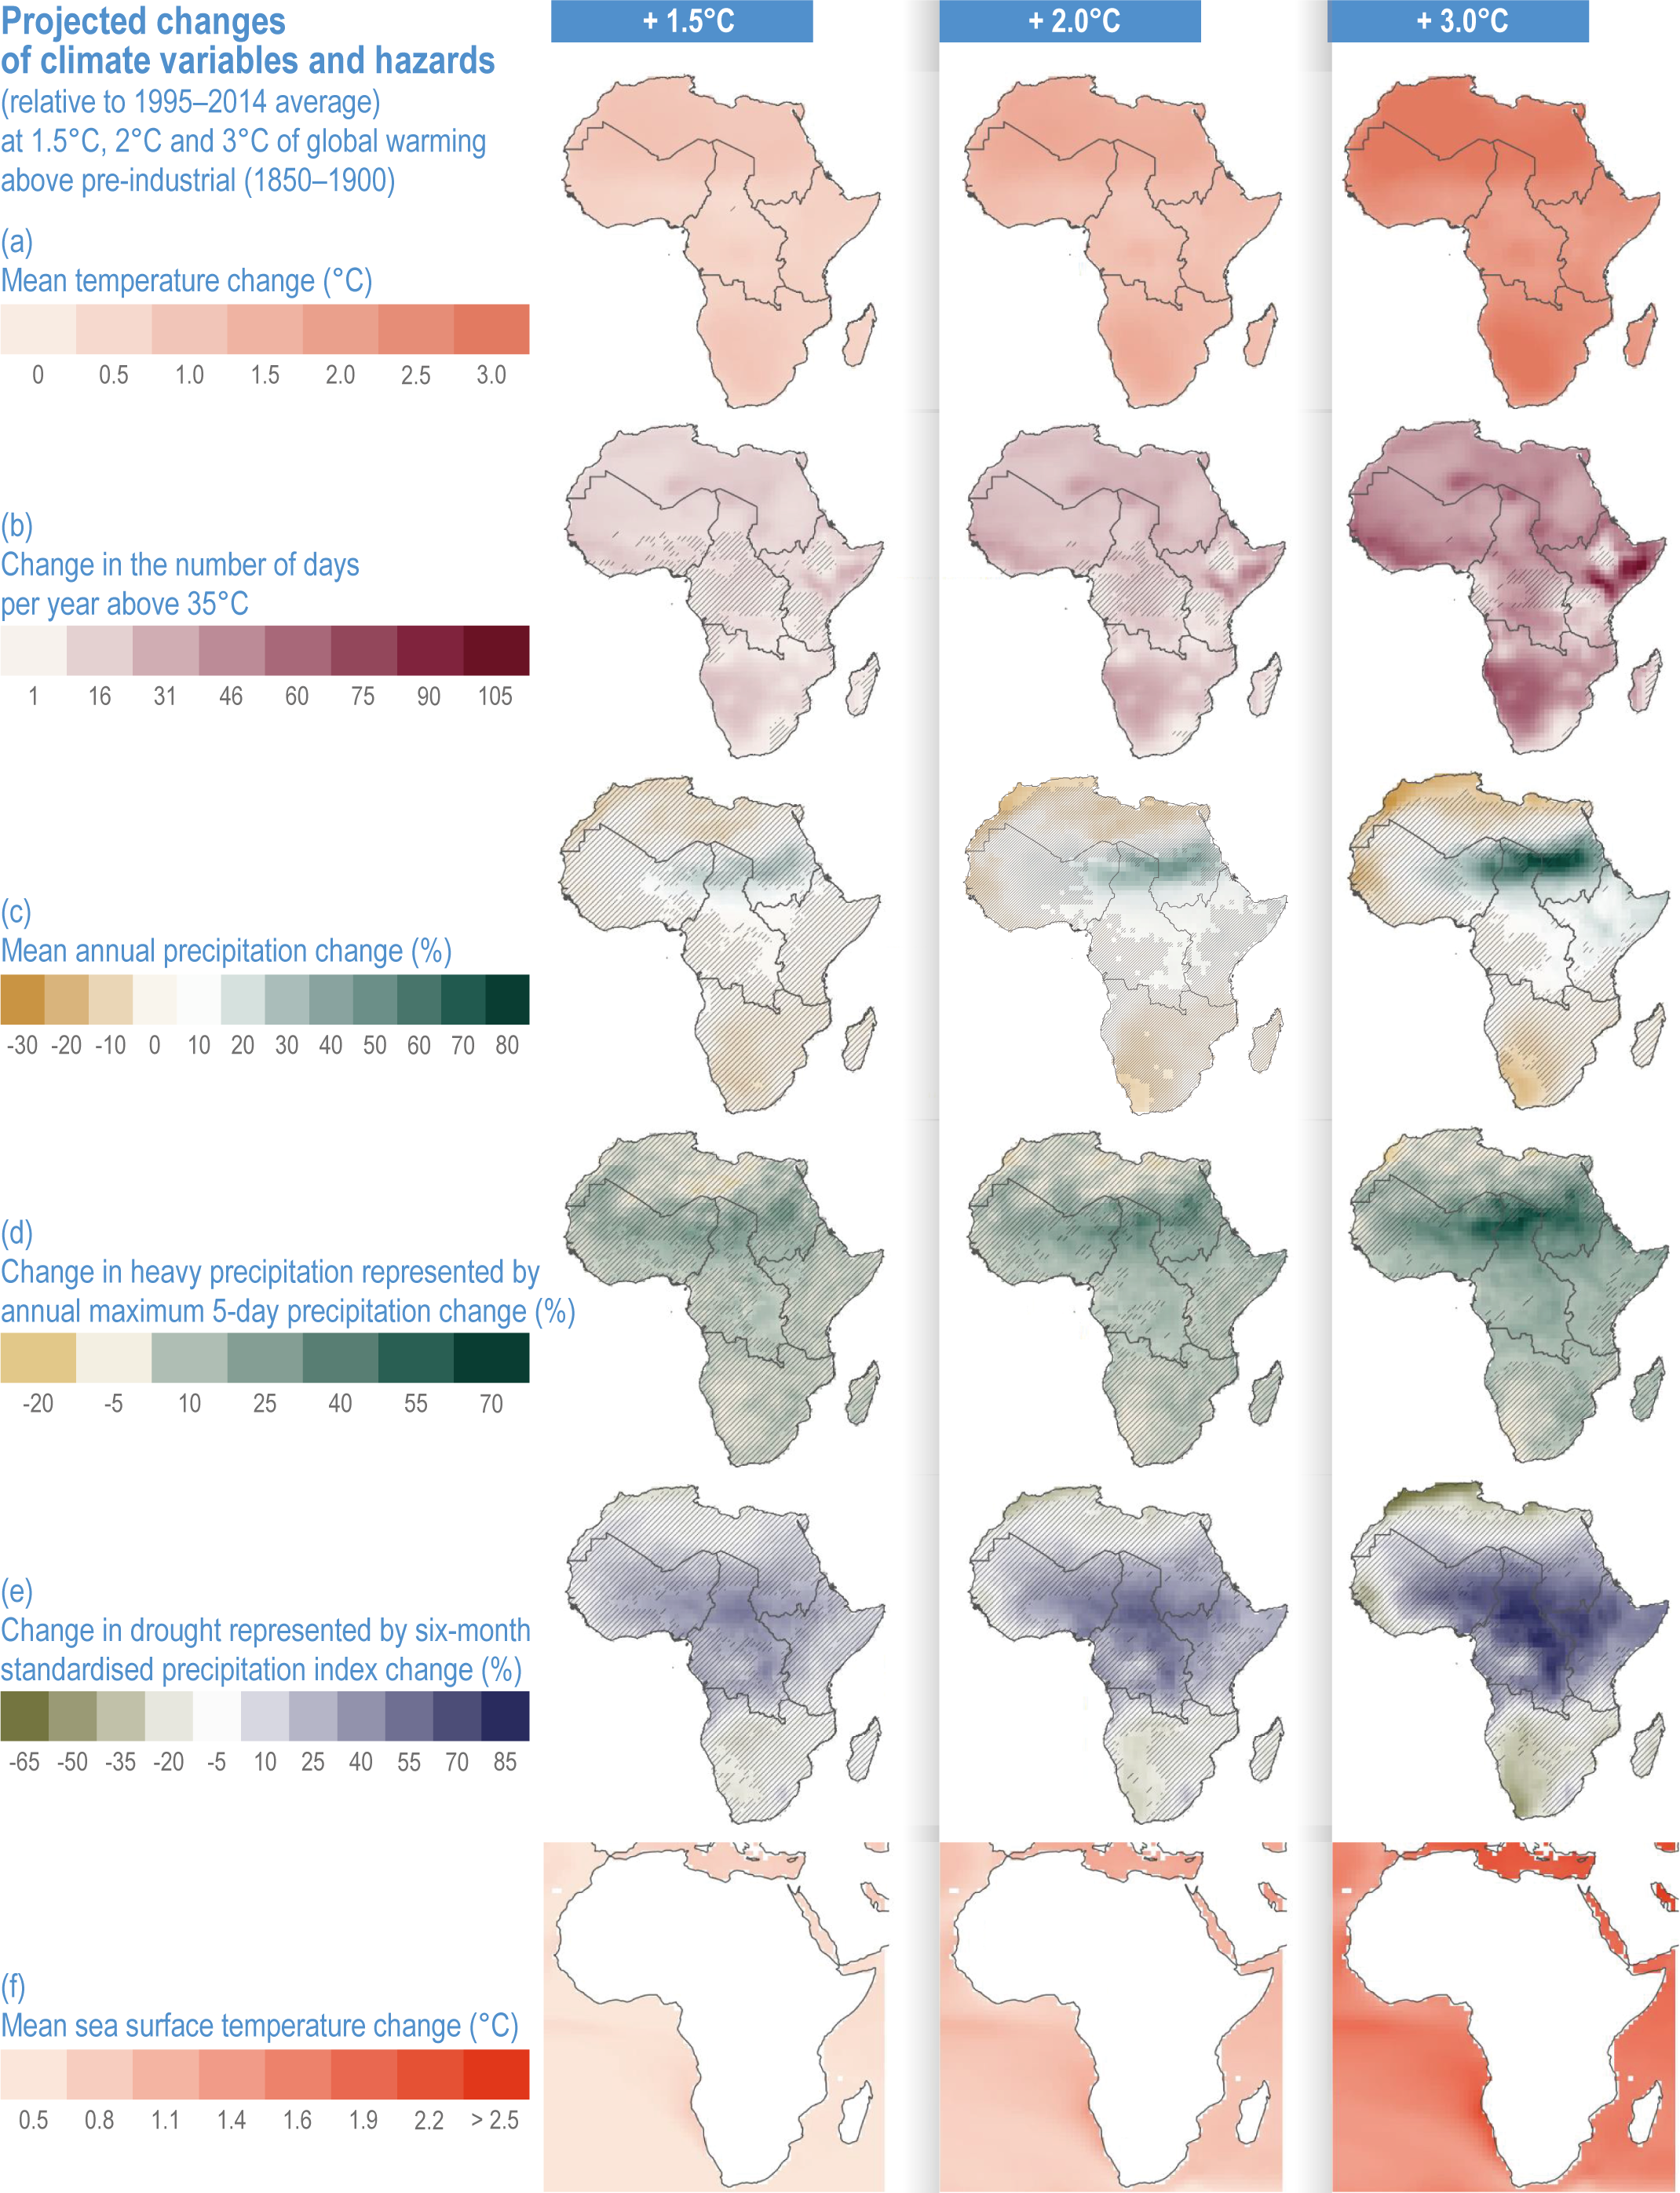
Figure caption
Figure 9.16 | Projected changes of climate variables and hazards at 1. 5°, 2°and 3°of global warming above the pre-industrial period (1850–1900).
Changes shown here are relative to the 1995–2014 period. Rows are
(a) Mean temperature change (°C);
(b) Change in the number of days per year above 35°C (days);
(c) Mean annual rainfall change (%);
(d) Heavy precipitation change represented by annual maximum 5-day precipitation (%);
(e) Change in drought represented by the six-month standardised precipitation index (SPI) (%) – negative changes indicate areas where drought frequency, intensity and/or duration is projected to increase and positive changes show the opposite;
(f) Mean sea surface temperature change (°C). All figures are derived from the WGI Interactive Atlas and show results from between 26 to 33 CMIP6 (Coupled Model Intercomparison Project) global climate models depending on the climate variable. CMIP6 models include improved representations of physical, biological, and chemical processes as well as higher spatial resolutions compared to previous CMIP5 models (Eyring et al., 2021). Robustness of the projected change signal is indicated by hatching – no overlay indicates high model agreement, where at least 80% of models agree on sign of change; diagonal lines (/) indicate low model agreement, where fewer than 80% of models agree on sign of change. NOTE: Model agreement is computed at a gridbox level and is not representative of regionally aggregated results over larger regions (Gutiérrez et al., 2021).