Figure 9.25
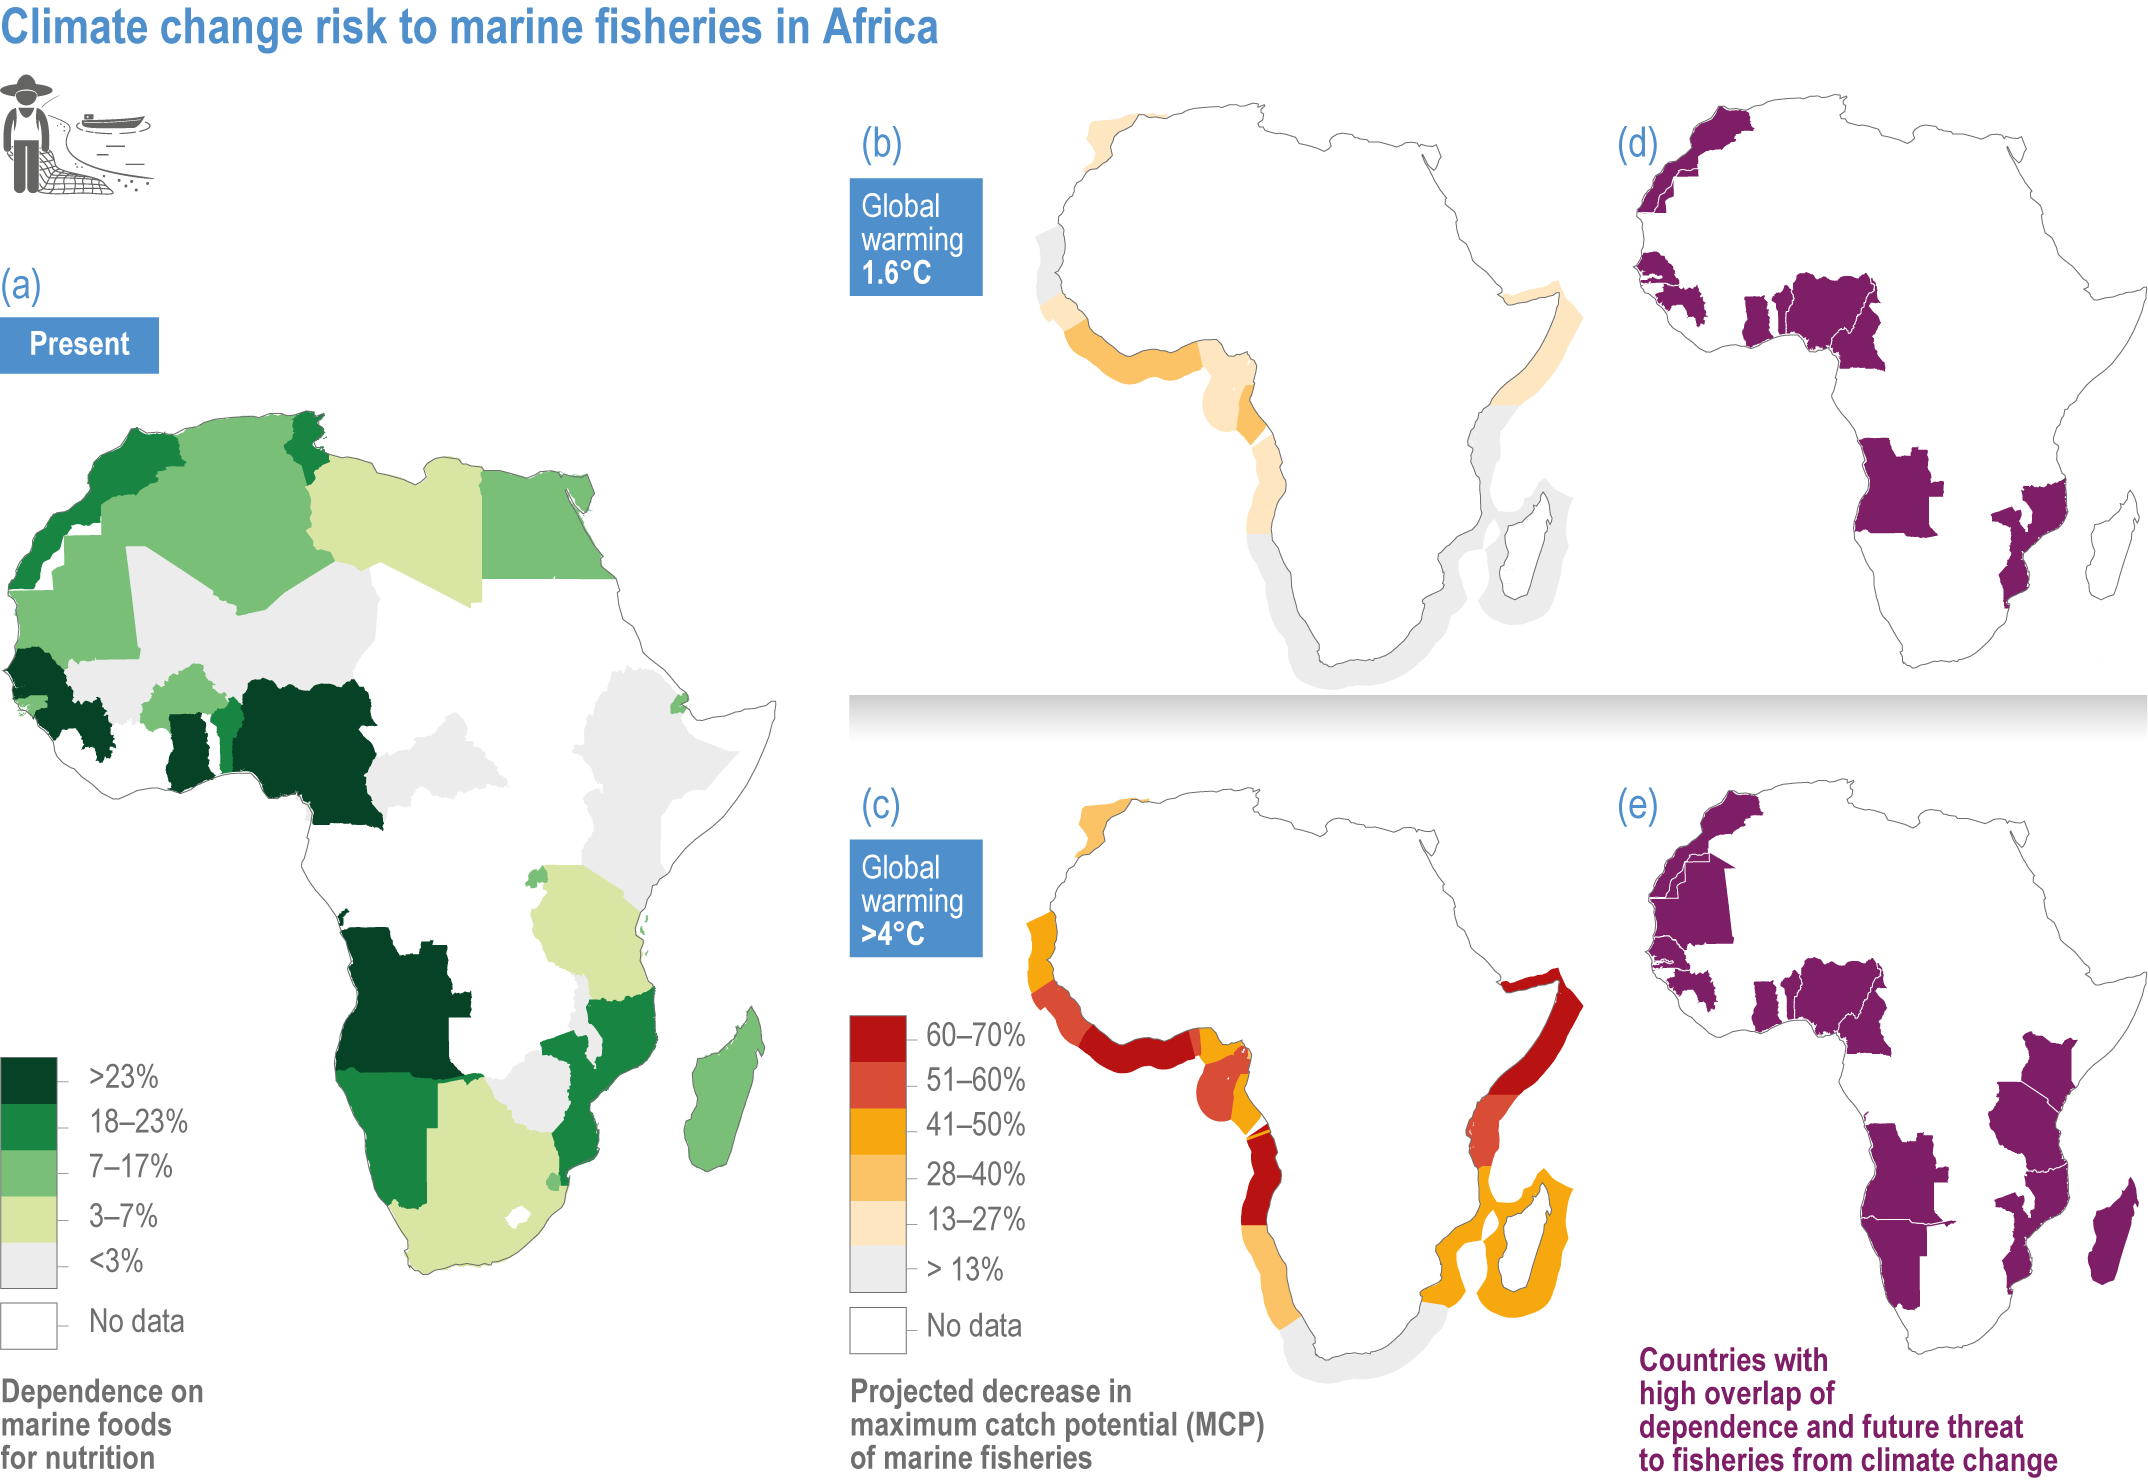
Figure caption
Figure 9.25 | Climate change increases risks to the catch potential and nutrition from marine fisheries.
(a) The percentage of animal source foods consumed that originate from a marine environment. Countries with higher dependence are indicated by darker shades of green (Golden et al., 2016).
(b–c) Projected percentage change in maximum catch potential of marine fisheries compared to the recent past (1986–2005) under 1.6°C global warming and >4°C global warming by end of 21st century (2081–2100) in countries’ Exclusive Economic Zones (EEZs) (Cheung William et al., 2016). Darker red indicates greater percentage reduction (negative values).
(d–e) Countries (in purple) that have overlap between high nutritional dependence on marine fisheries and high risk of reduction in maximum catch potential under the two global warming scenarios. Global warming levels were calculated using a baseline for pre-industrial global mean temperature of 1850–1900.