Figure 9.29
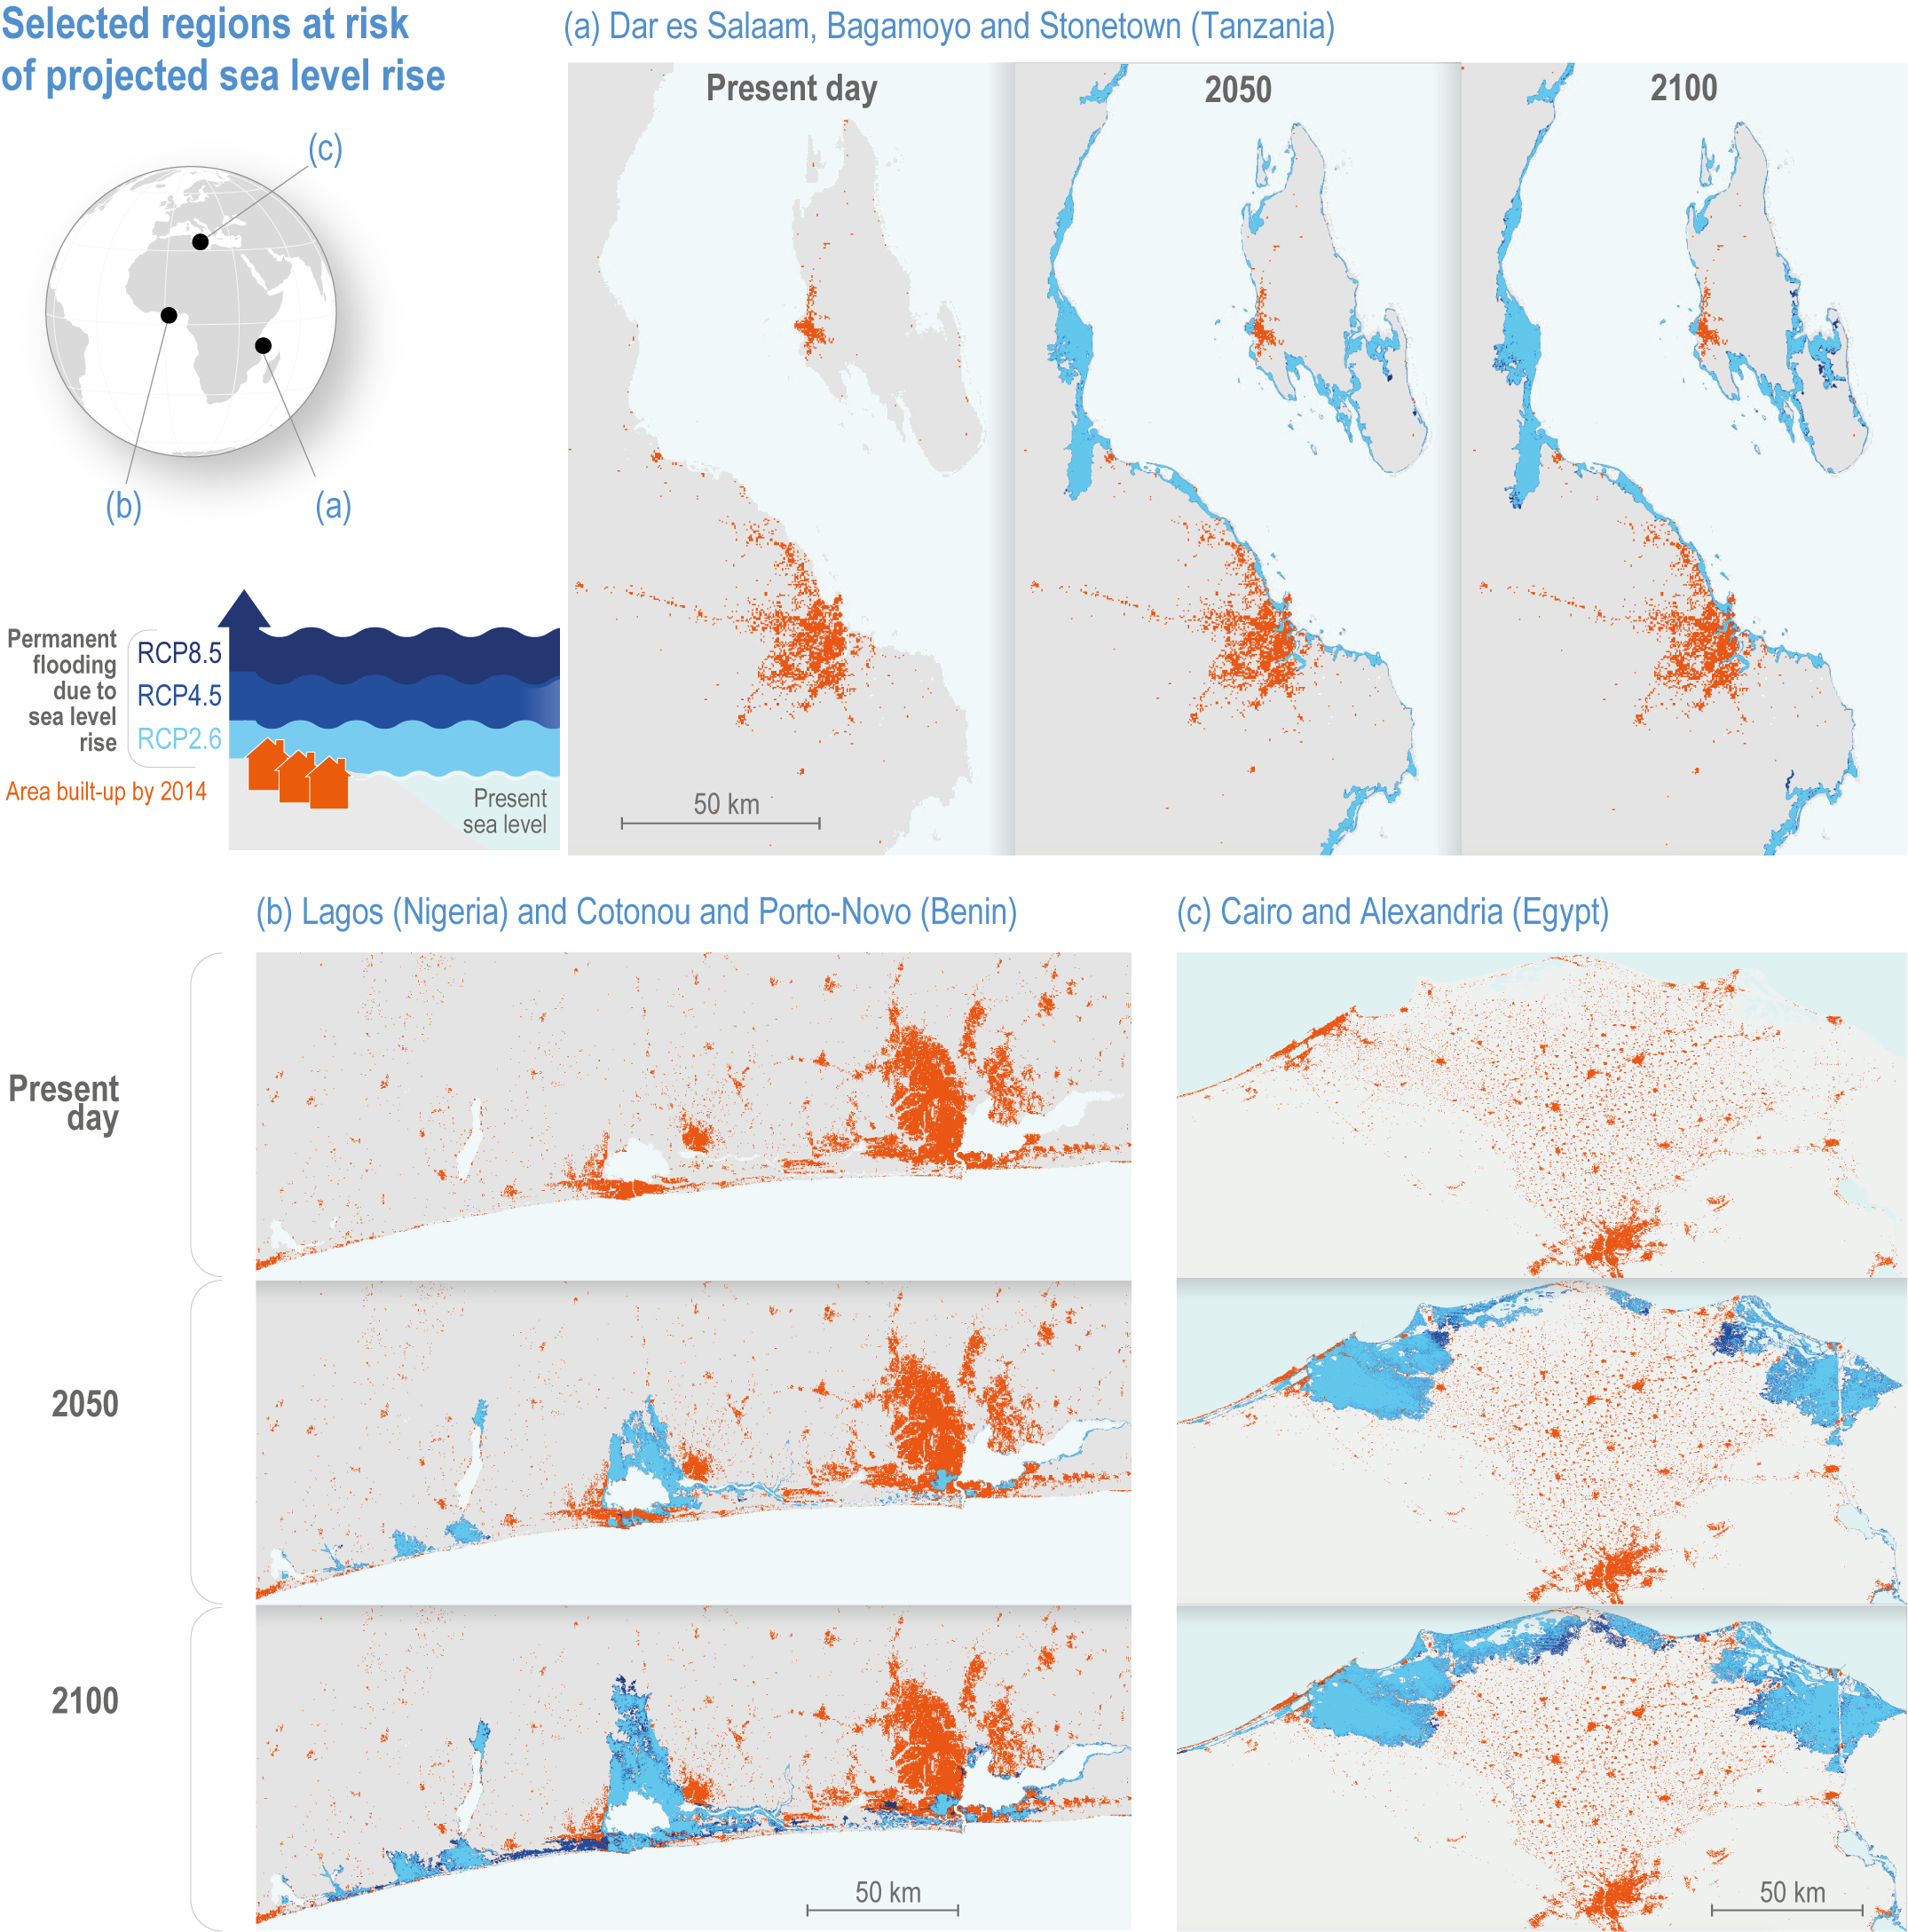
Figure caption
Figure 9.29 | Multiple large African cities will be exposed to sea level rise (SLR), these include the selected examples: (a) Dar es Salaam, Bagamoyo, and Stone Town in Tanzania (east Africa), (b) Lagos in Nigeria, and Cotonou and Porto-Novo in Benin (west Africa) and (c) Cairo and Alexandria in Egypt (north Africa). Orange shows built-up area in 2014. Shades of blue show permanent flooding due to SLR by 2050 and 2100 under low (RCP2.6), intermediate (RCP4.5) and high (RCP8.5) greenhouse gas emissions scenarios. Darker colours for higher emissions scenarios show areas projected to be flooded in addition to those for lower emissions scenarios. The figure assumes failure of coastal defences in 2050 and 2100. Some areas are already below current SLR and coastal defences need to be upgraded as SLRs (e.g., in Egypt), others are just above mean sea levels and they do not necessarily have high protection levels, so these defences need to be built (e.g., Dar es Salaam and Lagos). Blue shading shows permanent inundation surfaces predicted by Coastal Digital Elevation Model (DEM) and Shuttle Radar Topography Mission (SRTM) given the 95th percentile K14/RCP2.6, RCP4.5 and RCP8.5, for present day, 2050, and 2100 sea level projection for permanent inundation (inundation without a storm surge event), and RL10 (10-year return level storm) (Kulp and Strauss, 2019). Low-lying areas isolated from the ocean are removed from the inundation surface using connected components analysis. Current water bodies are derived from the SRTM Water Body Dataset. Orange areas represent the extent of coastal human settlements in 2014 (Corbane et al., 2018). See Figure CCP4.7 for projections including subsidence and worst-case scenario projections for 2100.