Figure Box 9.5.1
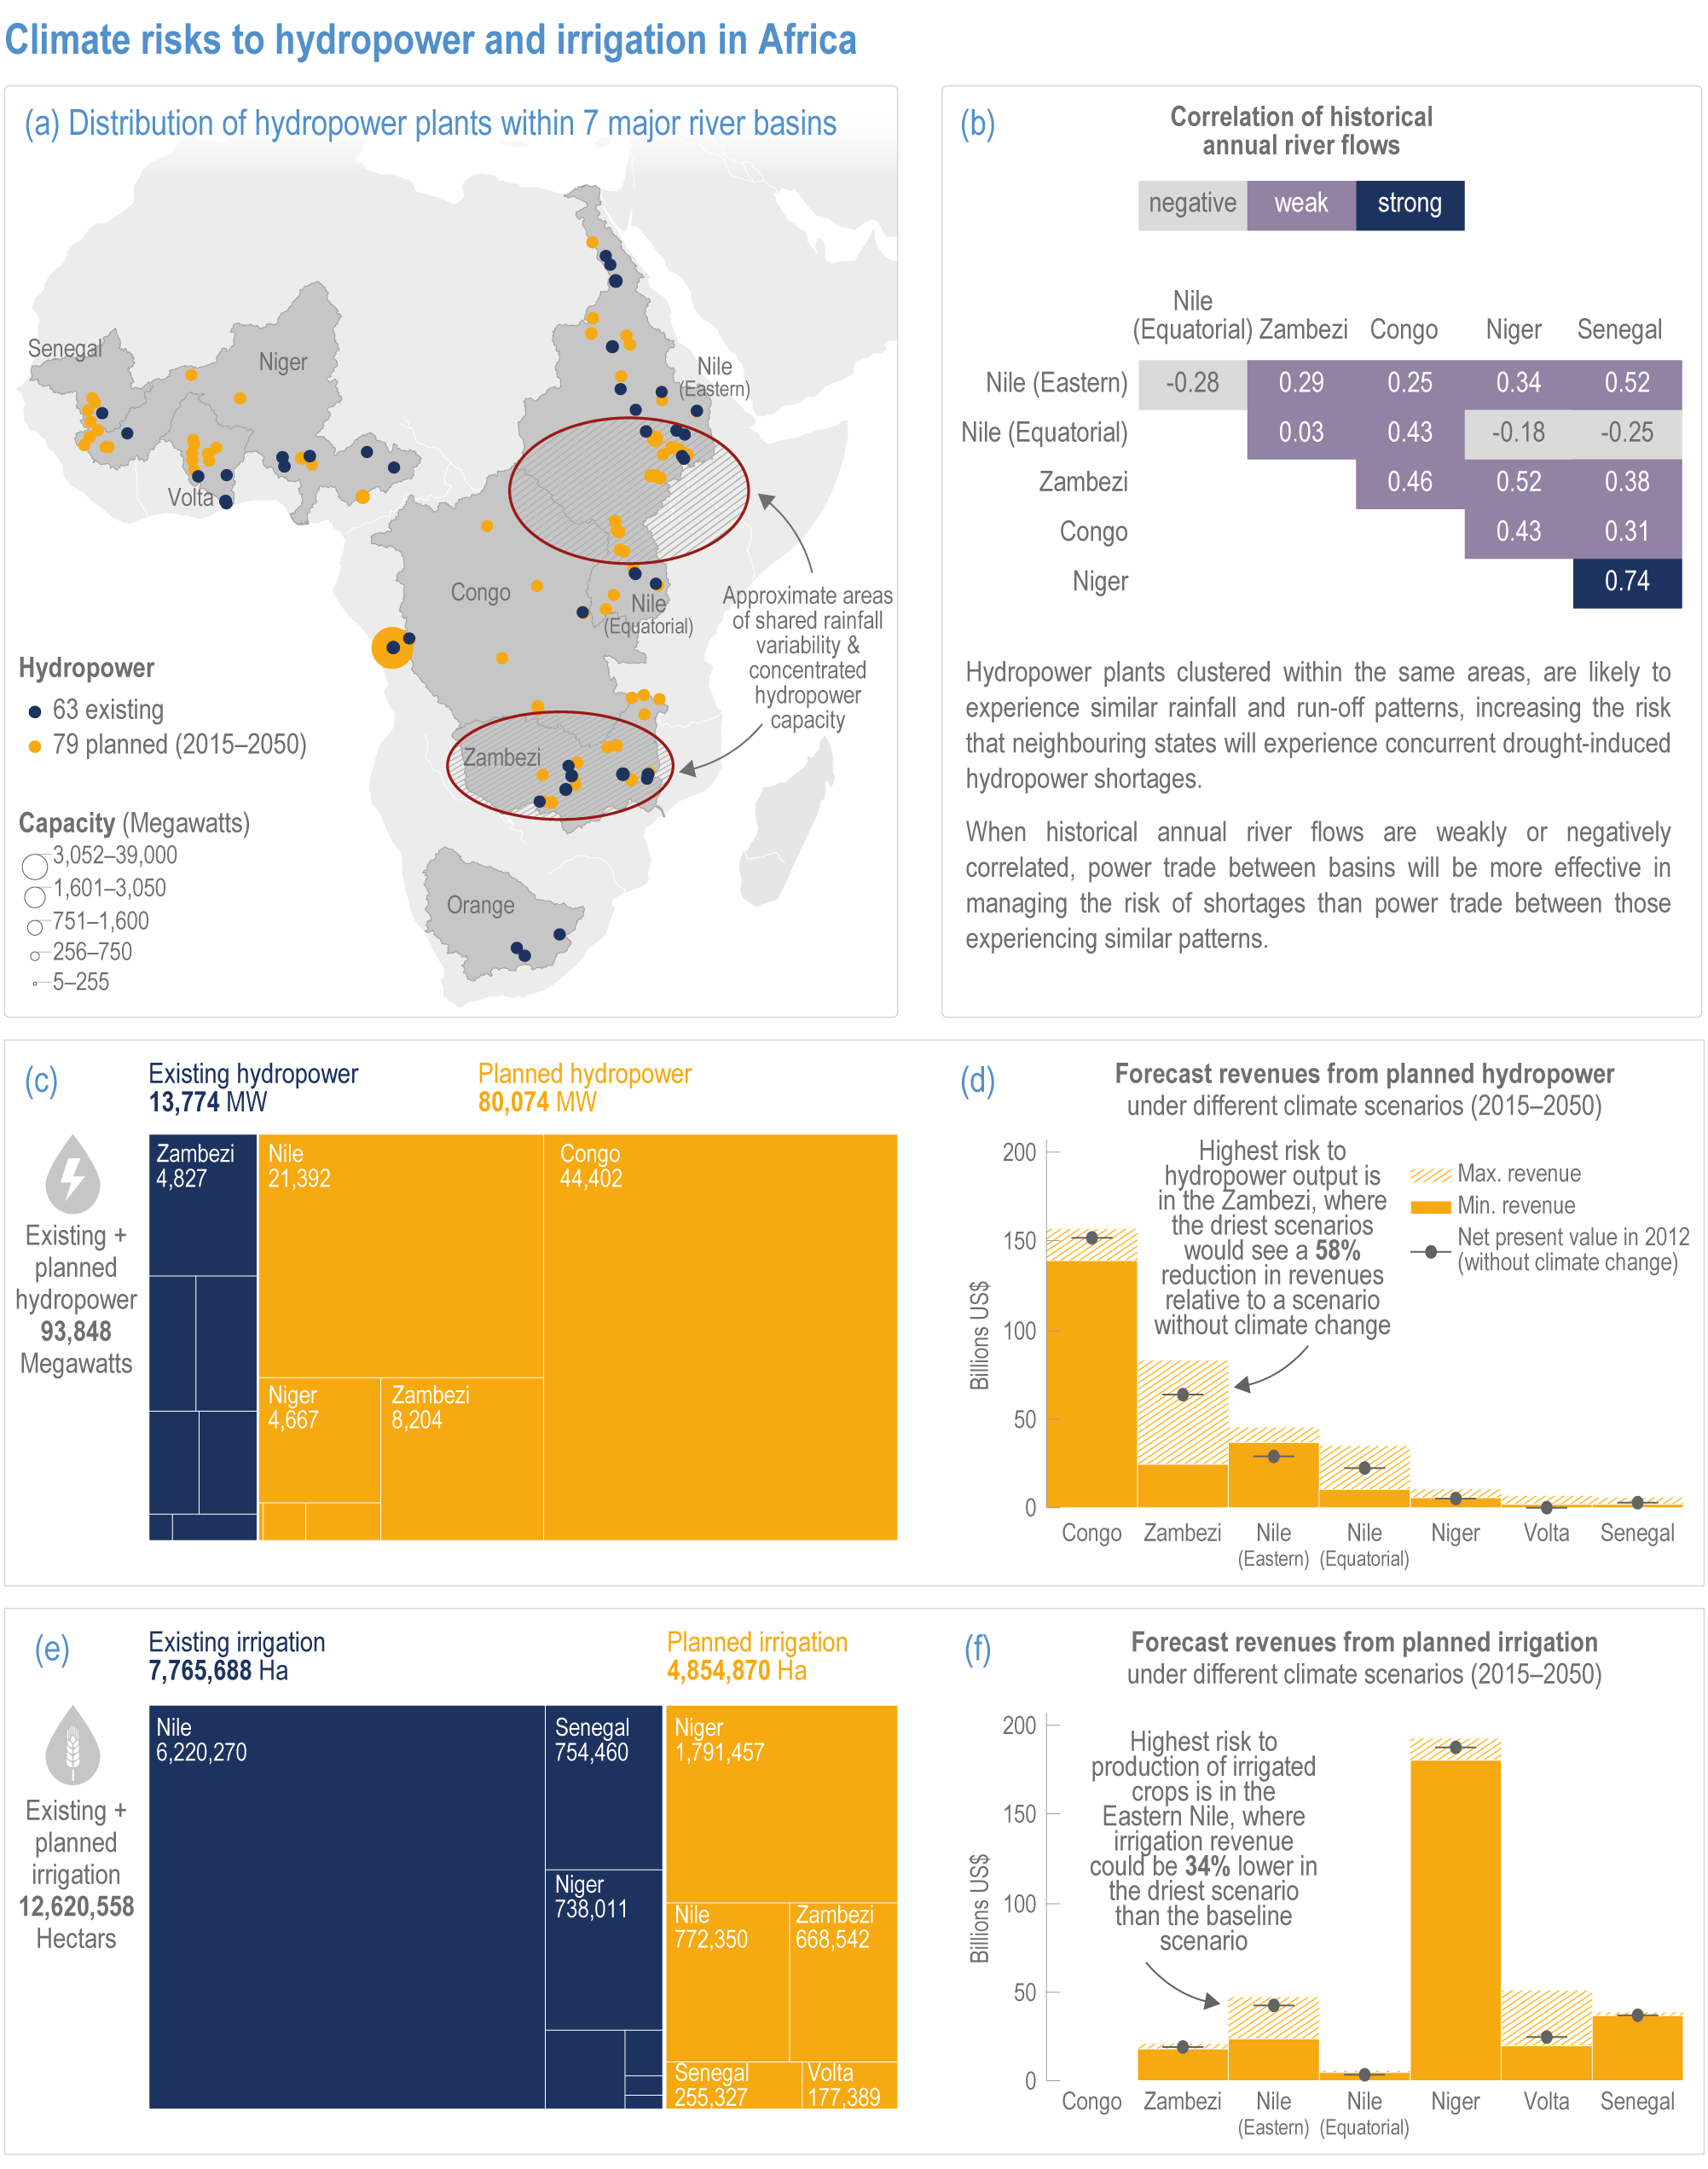
Figure caption
Figure Box 9.5.1 | Climate risks to hydropower and irrigation in Africa.
(a) The map shows the location and size of existing (blue) and planned (orange) hydropower plants in African governments’ infrastructure expansion plans, 2015–2050.
(b) Matrix shows historical correlations in annual river flows between some of the major river basins indicating risk of hydropower shortages where correlations are higher. (c, e) Existing and planned hydropower and irrigation are indicated in charts. Dark blue shows forecasted revenues from 2015–2050 of existing hydropower and irrigation in major African river basins in a scenario without further climate change (i.e., based on historical data). Orange in charts (c, e) shows the expected increase in hydropower and irrigation revenues as new hydropower and irrigation infrastructure is added based on planned infrastructure development (PIDA+) in a scenario without climate change.
(d, f) The bar graphs show the forecast revenues for hydropower and irrigation infrastructure in each river basin under 121 different climate scenarios from 2015–2050, highlighting risk to revenues from high variability in river discharge due to climate change. In river basins with a wide range of potential river flow outcomes due to climate change, such as the eastern Nile and Zambezi, there is substantial uncertainty around revenue forecasts and potential for large reductions in future revenue. Hydropower revenues refer to net present value of hydroelectricity produced in each river basin over the period 2015–2050, and irrigation revenues refer to the crop revenues per hectare for each crop multiplied by the number of hectares of each crop across the basin. All figures are estimates of the net present value of revenues, using a discount rate of 3%, and are in 2012 USD billions. The 121 potential climate futures were derived using different General Circulation Models (GCMs), Representative Concentration Pathways (RCPs), and downscaling methods. IPCC AR4 and AR5 provided data from 22 and 23 GCMs, respectively. These were evaluated across two or three emissions pathways, including RCP4.5 and RCP8.5. The Bias Corrected Spatial Disaggregation method of downscaling was then used to derive 99 potential climate futures. An additional 22 climate futures (11 GCMs driven by the RCP4.5 and RCP8.5 emissions pathways) were produced using the Empirical Statistical Downscaling Methods developed at the Climate Systems Analysis Group at the University of Cape Town. Data sourced from Cervigni et al. (2015).