Back chapter figures
Figure CCP1.5
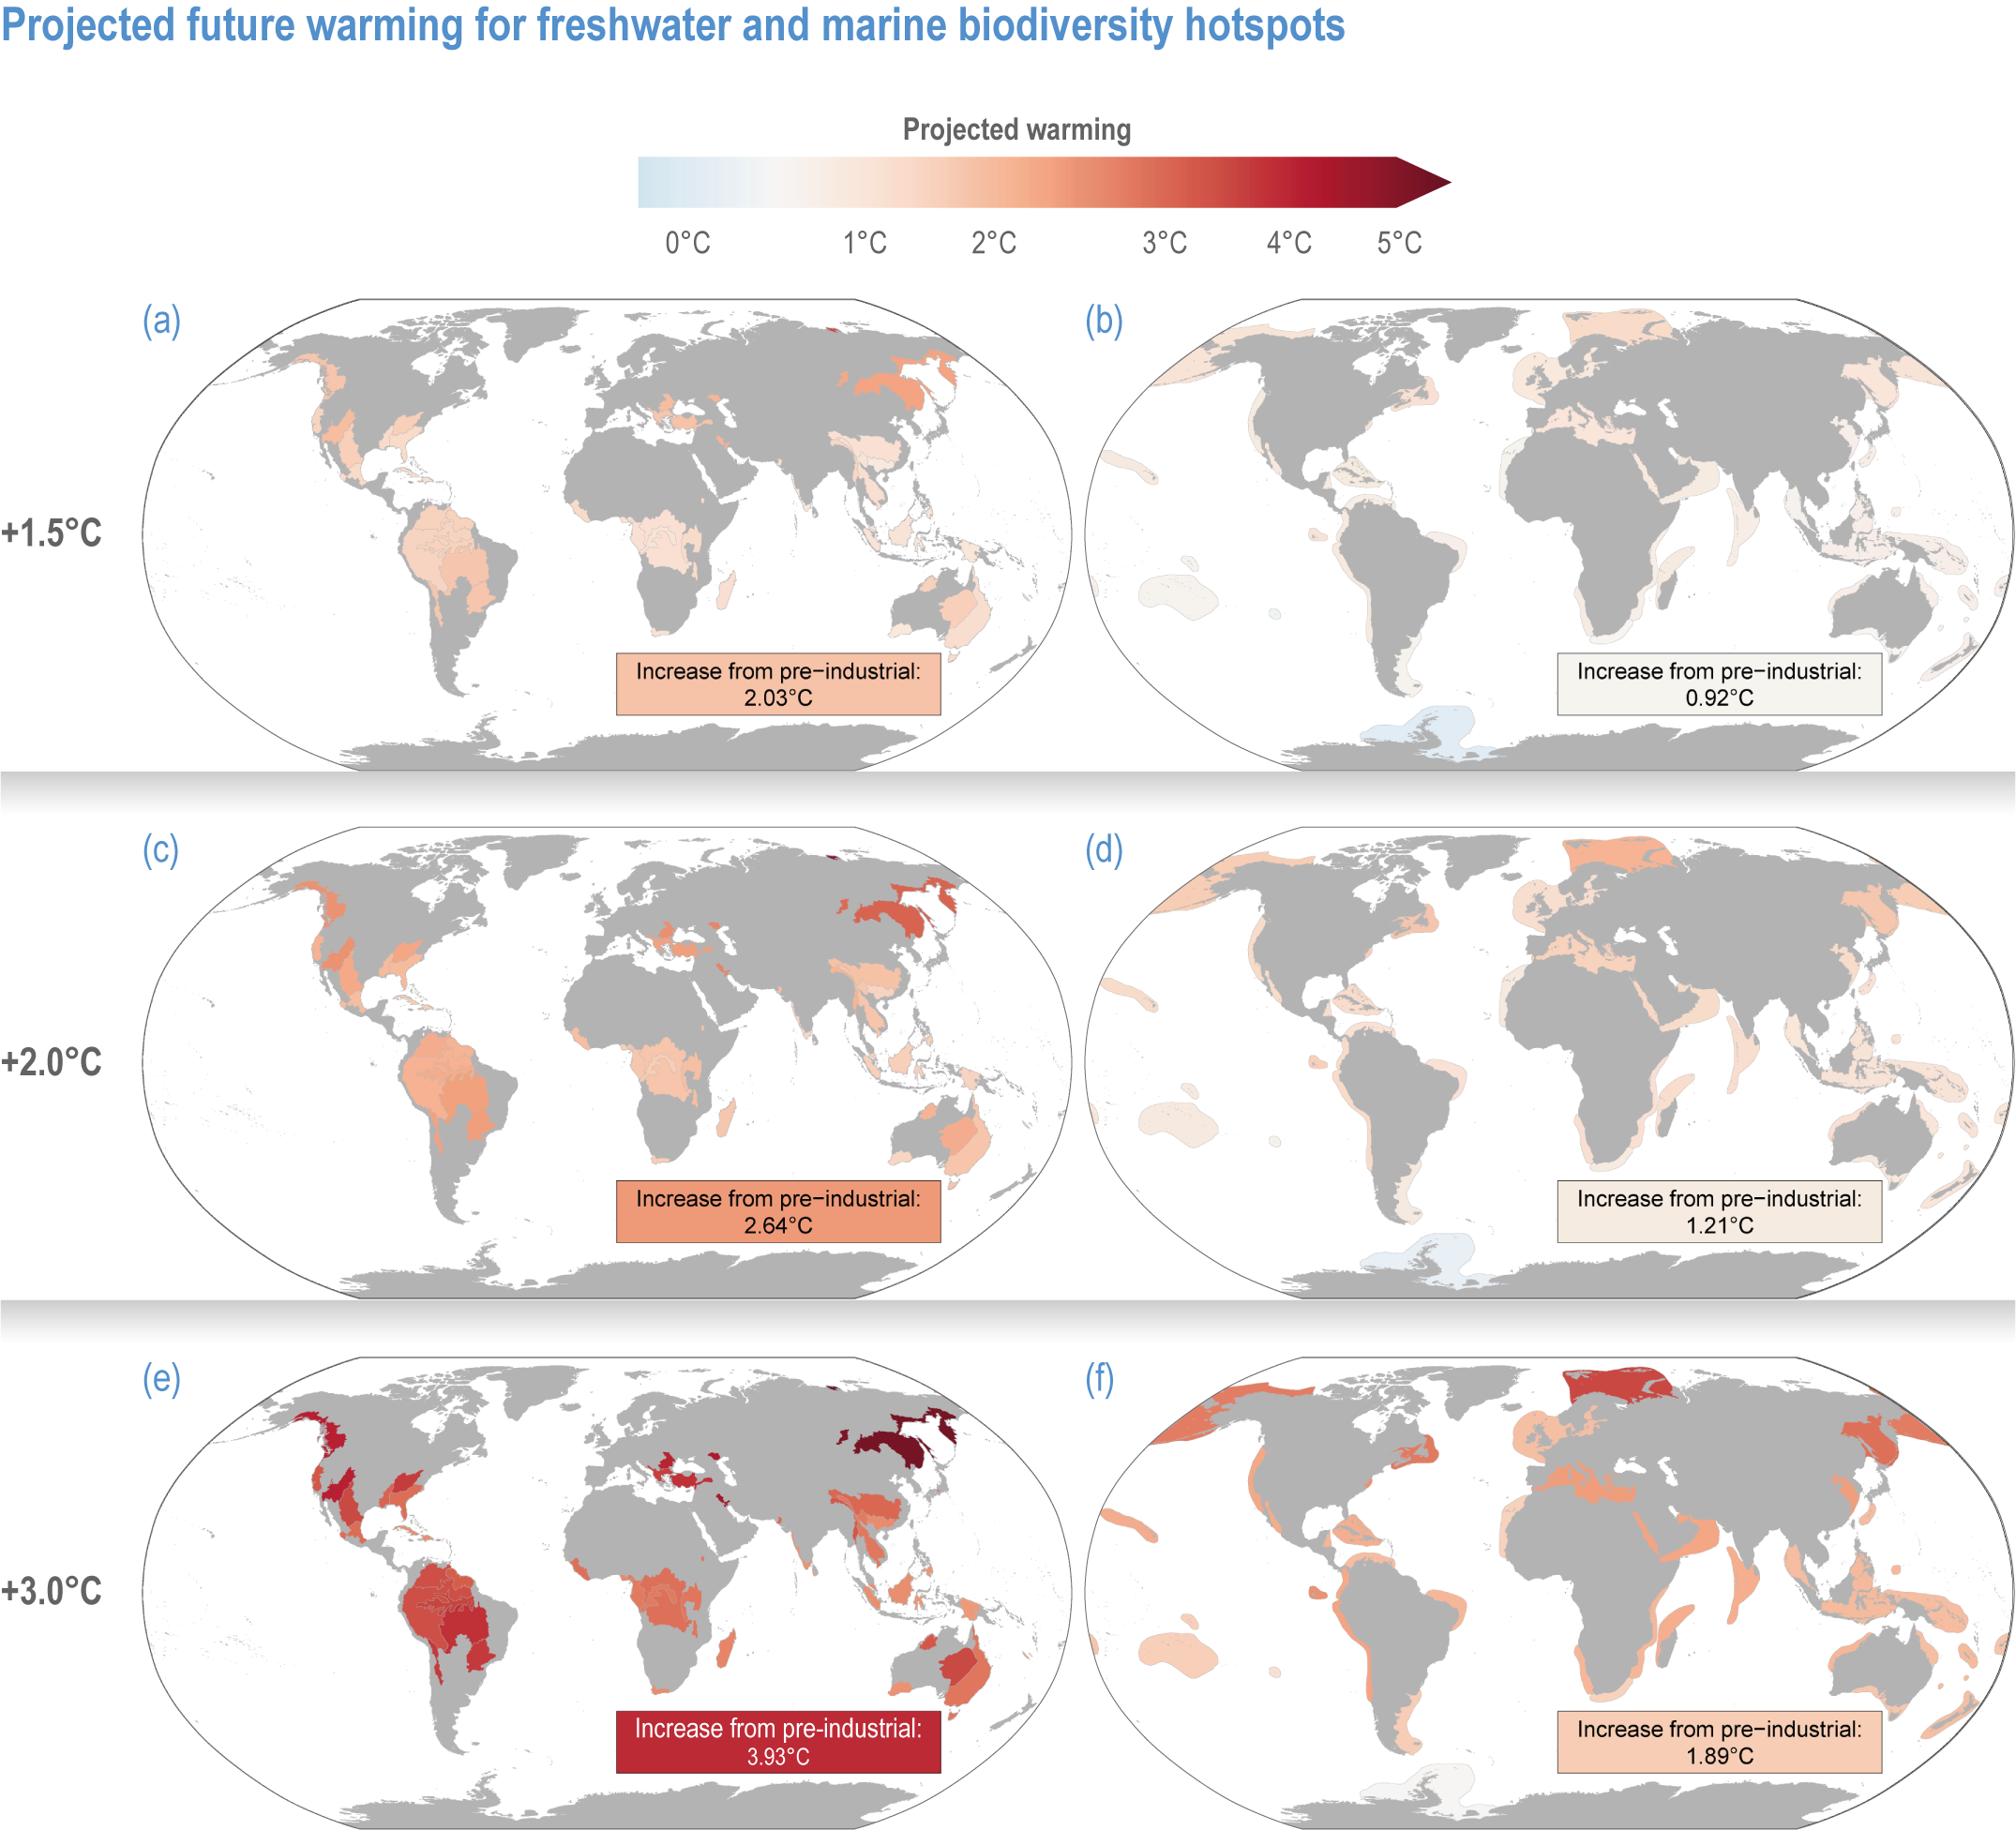
Figure caption
Figure CCP1.5 | Projected future warming in degrees Celsius for freshwater (left column, near-surface air temperature, panels a, c and e) and marine (right column as sea surface temperature, panels b, d and f) hotspots for a global average warming of +1.5°C (a, b), +2°C (c, d) and +3°C (e, f) compared to pre-industrial conditions. Values in text boxes in the figures indicate temperature increase from present-day (2005–2014) settings. Projected temperatures were calculated with averages of multi-model, yearly means across Shared Socioeconomic Pathways (SSP) 1.26 (only for +1.5°C), SSP2-45, SSP3-70 and SSP5-85.