Back chapter figures
Figure CCP1.7
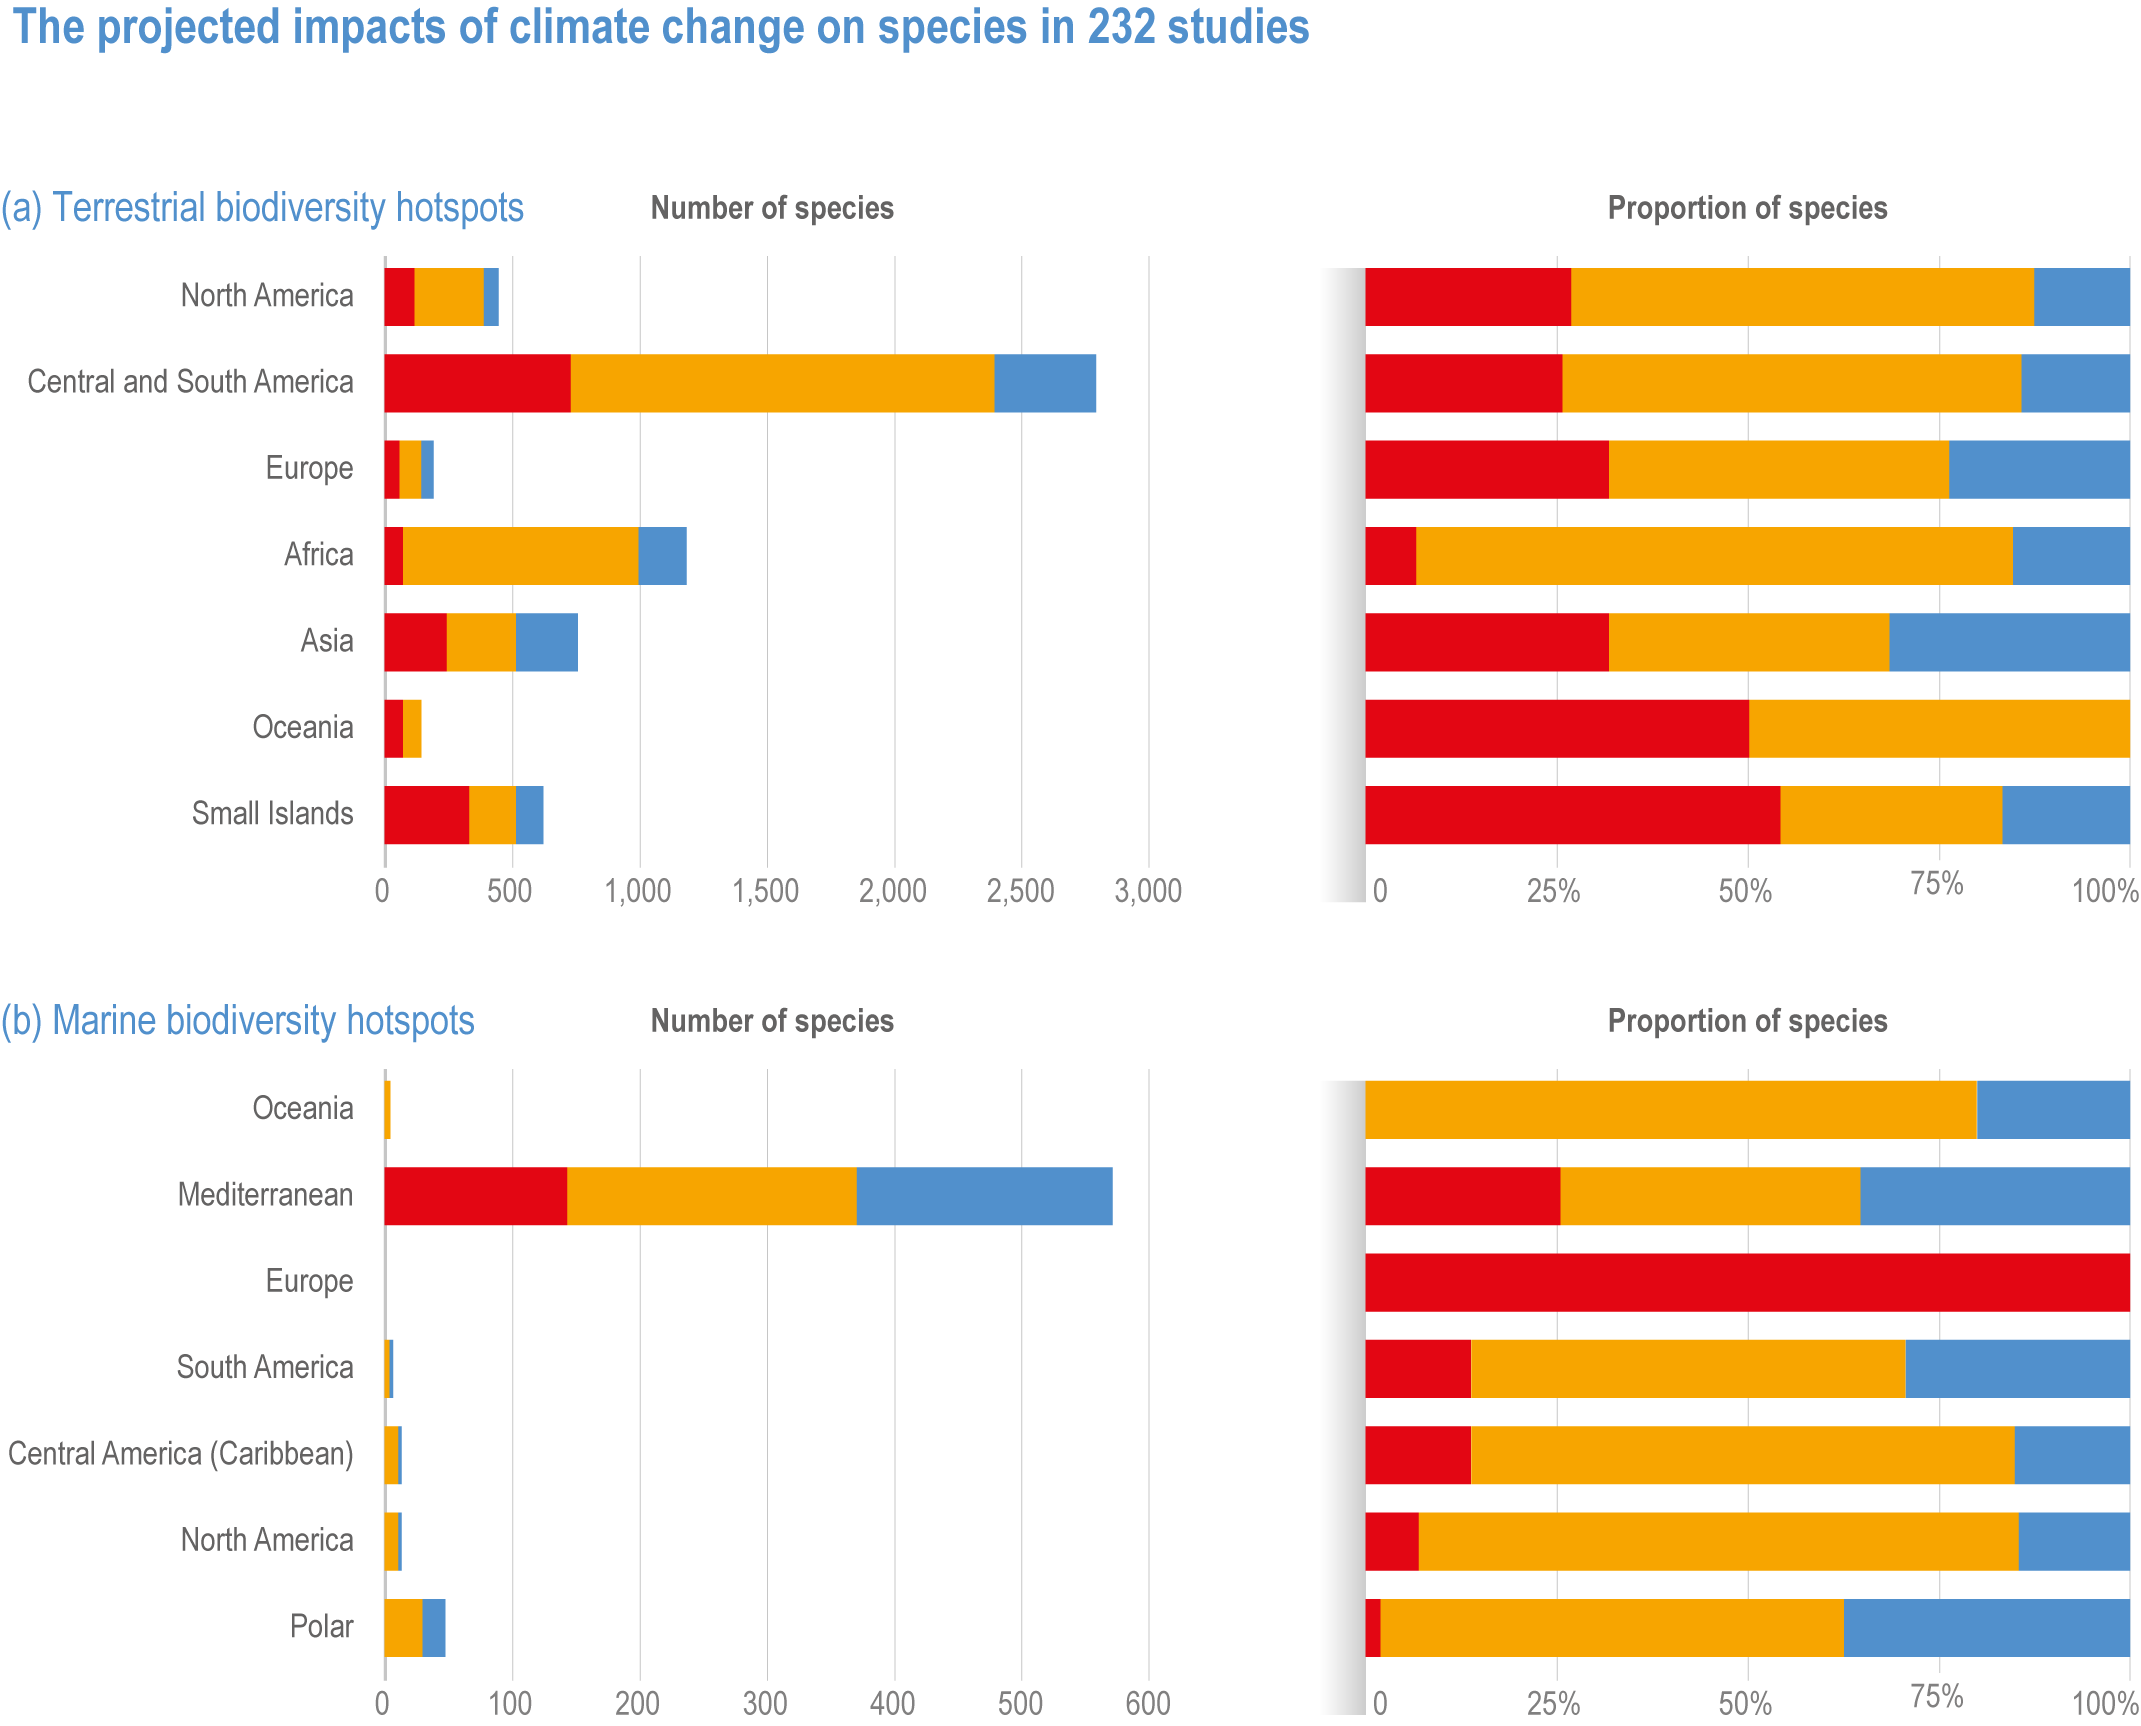
Figure caption
Figure CCP1.7 | The projected impacts of climate change on species in 232 studies (a) terrestrial and (b) marine hotspots (adapted from Manes et al., 2021), illustrating the number and percentage of species showing positive (blue) and negative (orange) responses to climate change, and threatened with extinction (red). Note Oceania includes Australia, New Zealand, Wallacea, New Guinea, New Caledonia, Polynesia and Micronesia and overlaps the global Small Islands category, which excludes Australia. The Small Islands category represents oceanic and continent-associated small islands, and thus overlaps with Oceania and continental data.