Back chapter figures
Figure CCP2.3
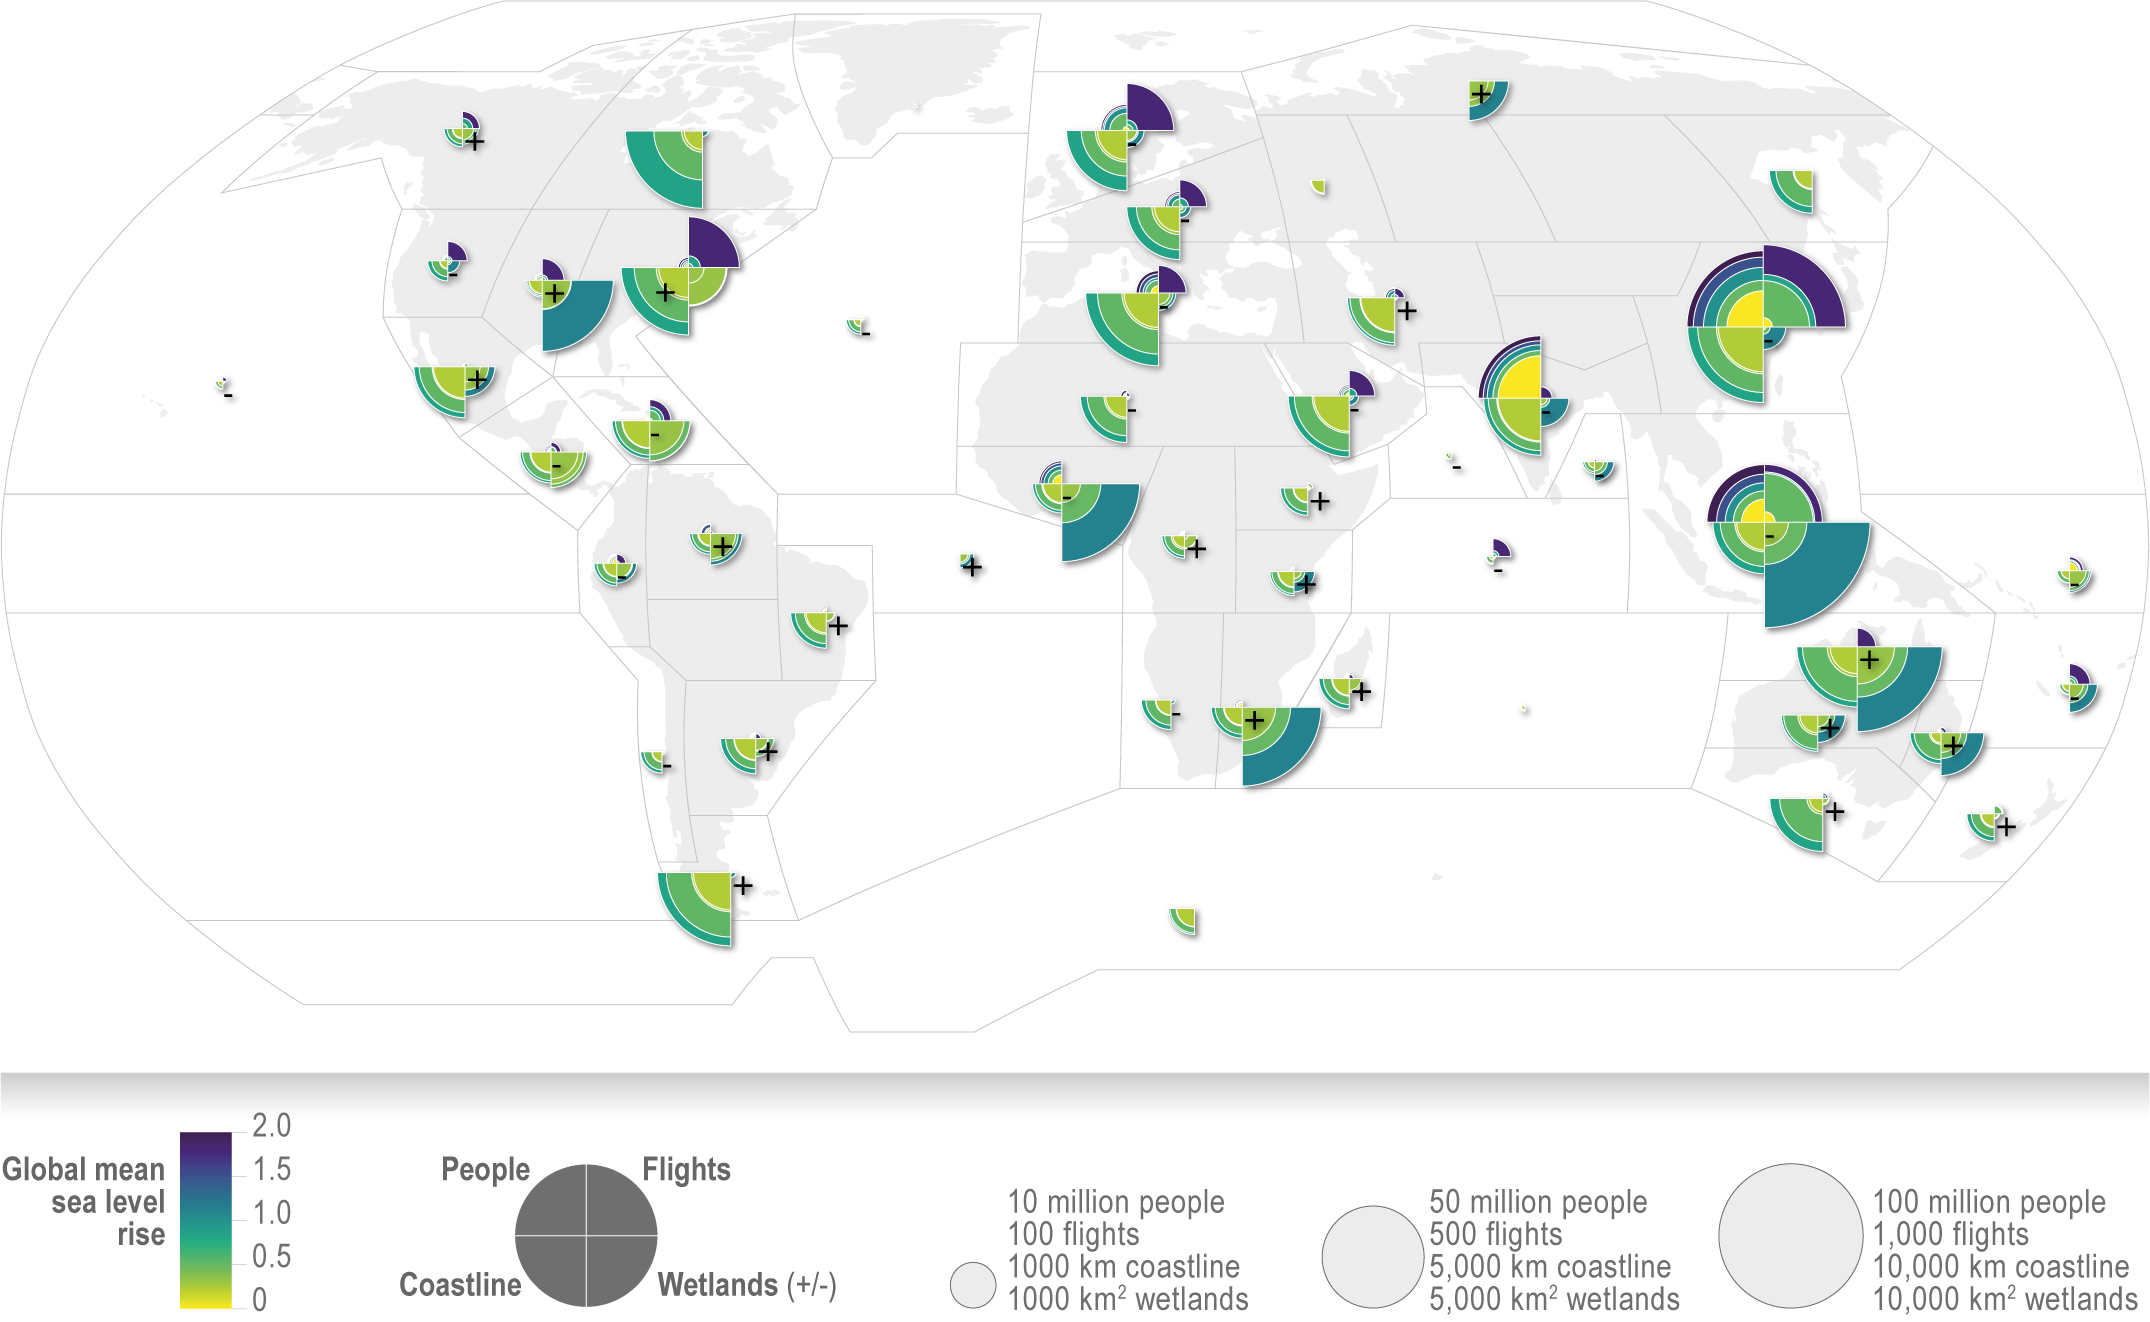
Figure caption
Figure CCP2.3 | Map of coastal cities and settlements’ risks according to IPCC regions, showing risks to people (number of people at risk from a 100-year coastal flood event; Haasnoot et al., 2021b), risks of loss of coastal land (length of coast with more than 100 m retreat; Vousdoukas et al., 2020b), risks to the built environment (airports at risk indicated by expected annual number of flights disrupted by coastal flooding (Yesudian and Dawson, 2021) and risk to wetlands (± indicates positive or negative area change; Schuerch et al., 2018). Risks are reported against global mean sea level rise relative to 2020, depending on data availability.