Figure CCP3.1
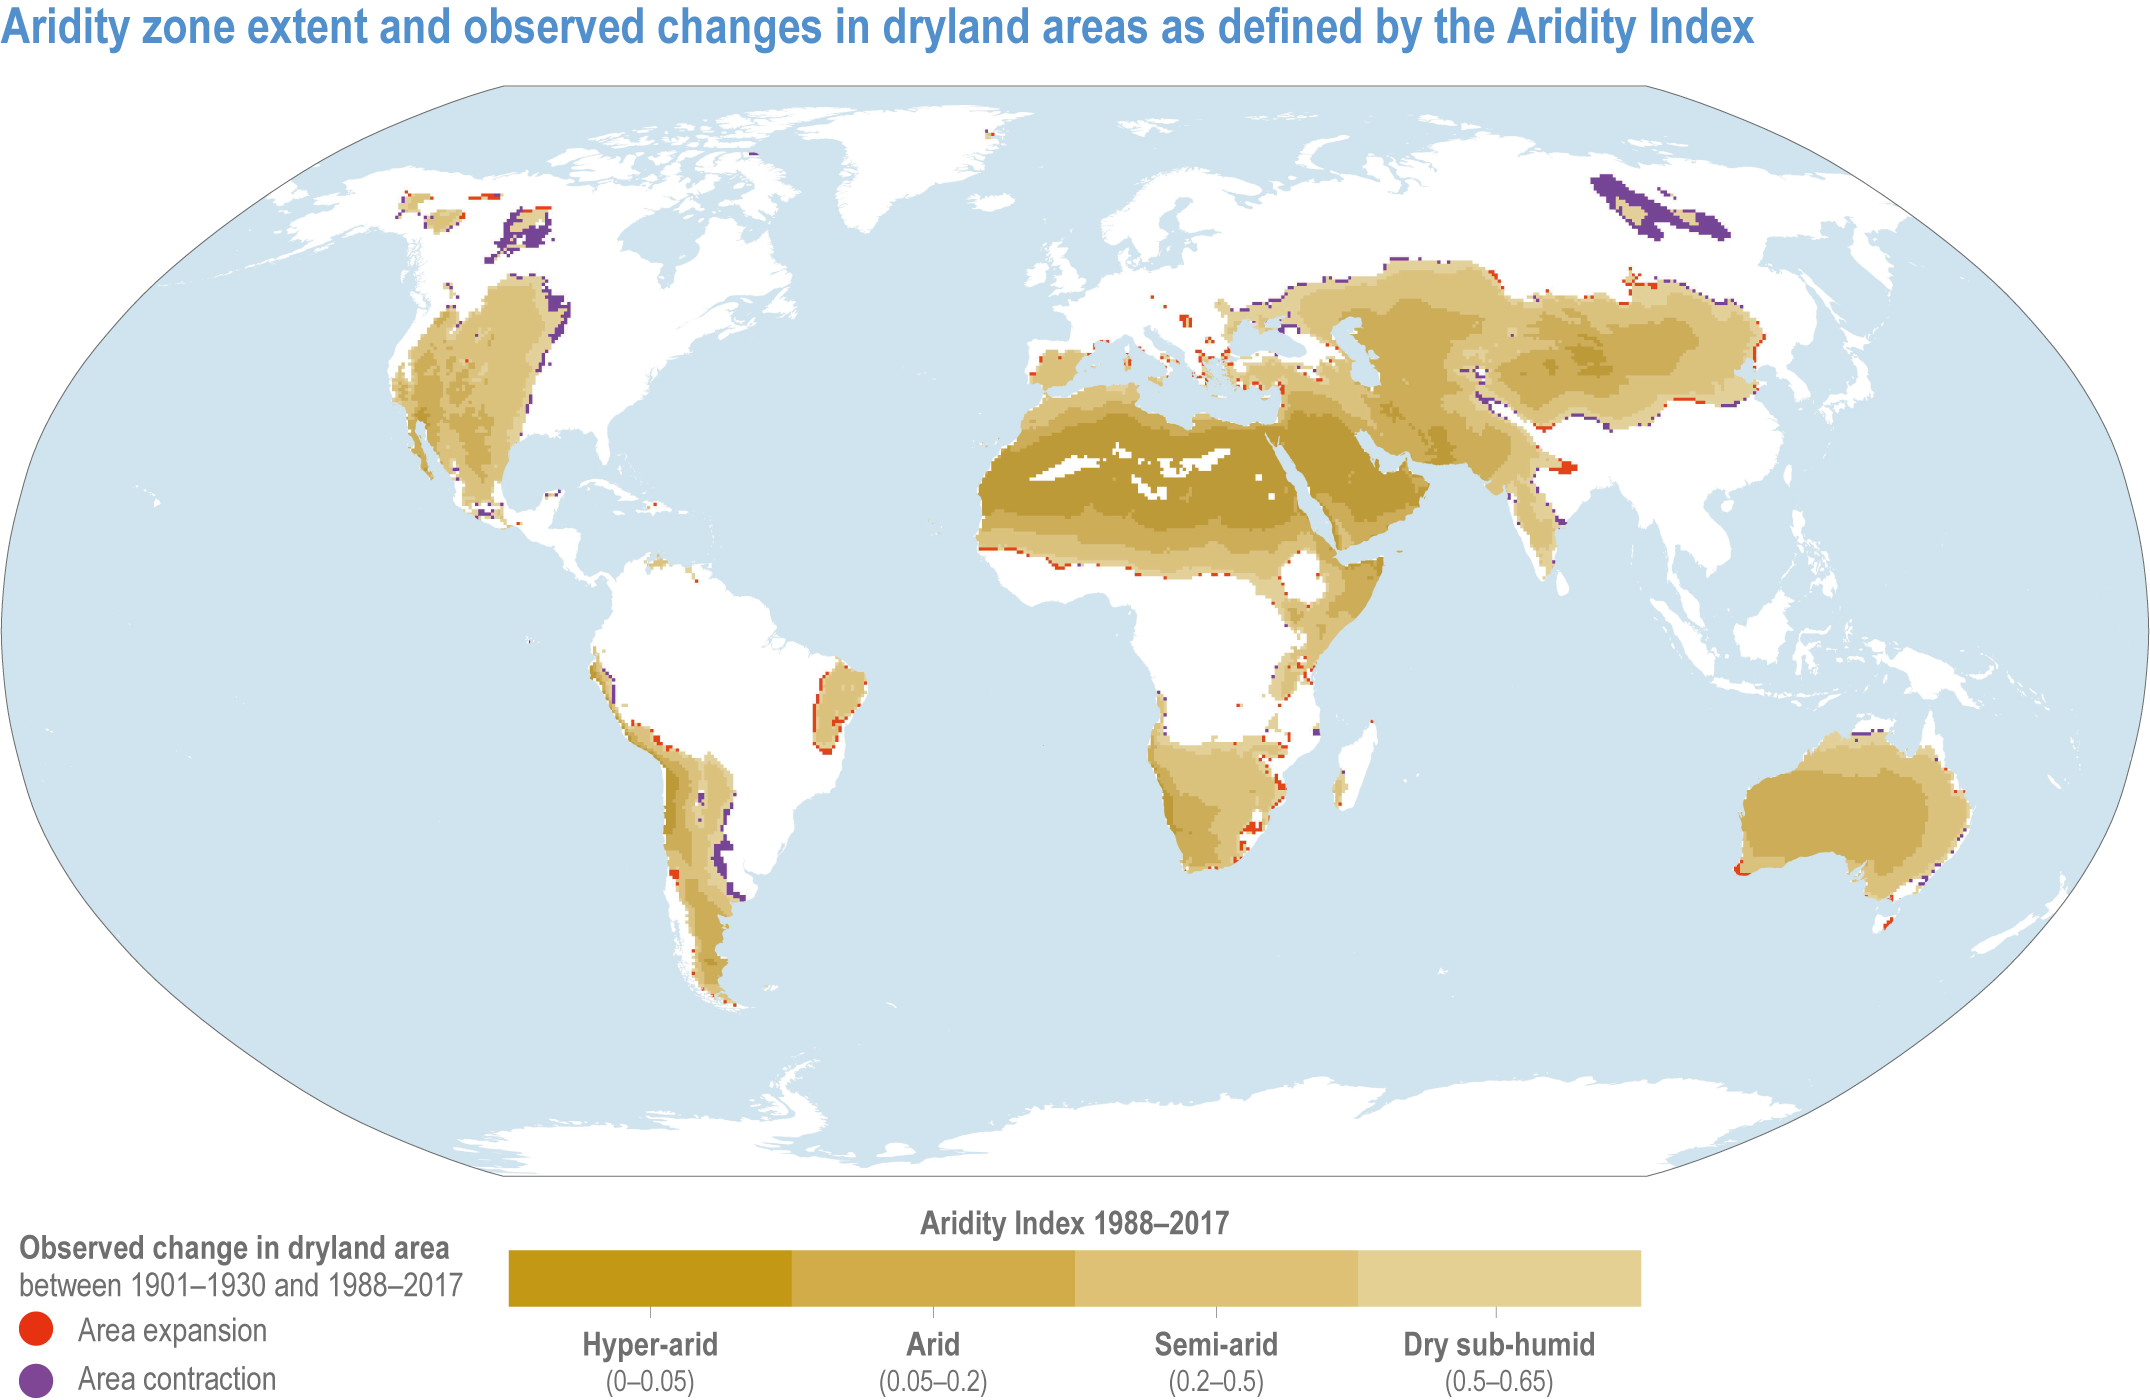
Figure caption
Figure CCP3.1 | Aridity zone extent and observed changes in dryland areas as defined by the Aridity Index (AI). Aridity zones, according to UNESCO (1979) and UNEP (1992) classifications, defined by the AI, consider the ratio of average annual precipitation to potential evapotranspiration: (i) dry sub-humid (0.5 ≤ AI < 0.65), (ii) semiarid (0.2 ≤ AI < 0.5), (iii) arid (0.05 ≤ AI < 0.2) and (iv) hyper-arid (AI <0.05). Drylands include land with AI <0.65, humid lands are those with AI >0.65 (UNEP, 1992). Deserts represent a major part of the hyper-arid and arid zones. The aridity zones are shown for climate in the period 1988–2017 and changes in dryland area (combined area of four aridity zones) are shown between the periods 1901–1930 and 1988–2017, based on climate time series at 50 km spatial resolution (Harris et al., 2020). The AI has various limitations in assessing dryland expansion and different indices highlight different areas and different changes. This is known as the aridity paradox (Greve et al., 2019). See SRCCL Section 3.2.1 (Mirzabaev et al., 2019) for an in-depth analysis of limitations, and Stringer et al. (2021) for a summary of different measures and indices used in the literature.