Back chapter figures
Figure CCP4.9
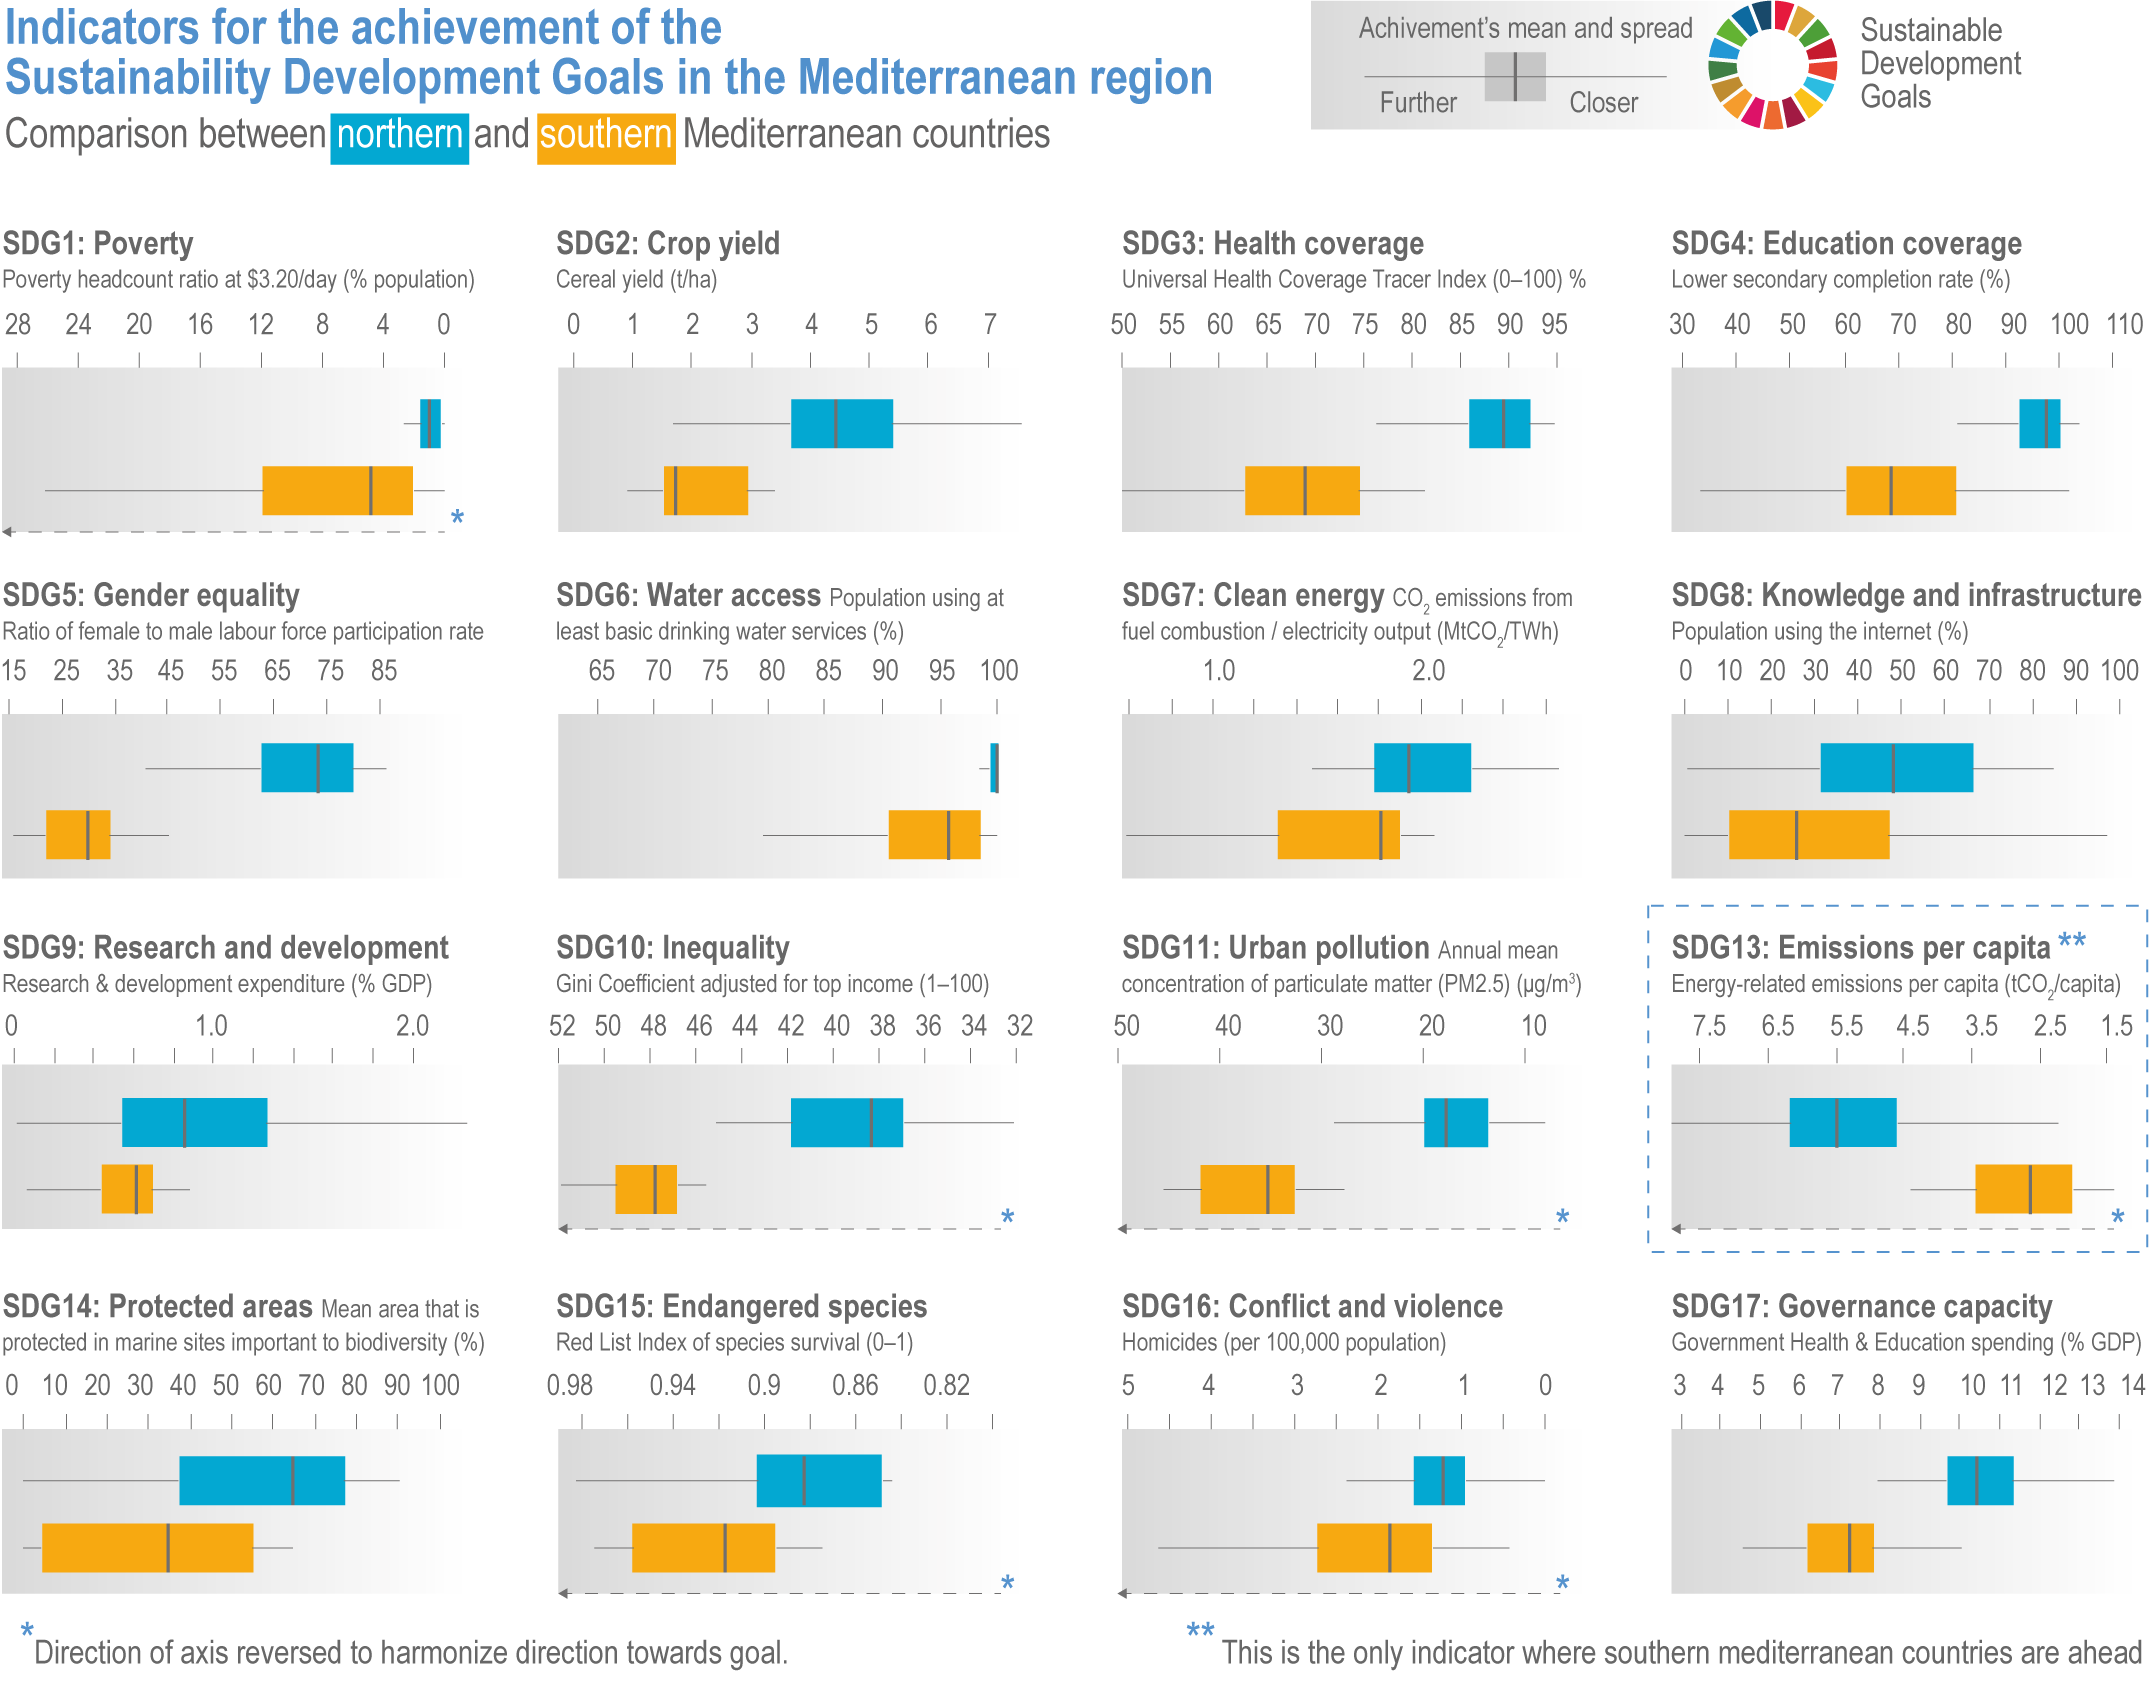
Figure caption
Figure CCP4.9 | Differences in present-day SDG indicator values between northern (blue) and southern (gold) Mediterranean countries. Yellow-shaded areas indicate better indicator values for the SDG descriptor. Red-shaded areas indicate poor performance on SDG values. Details of calculations and indicators in Table SMCCP4.3.