Figure CCP6.2
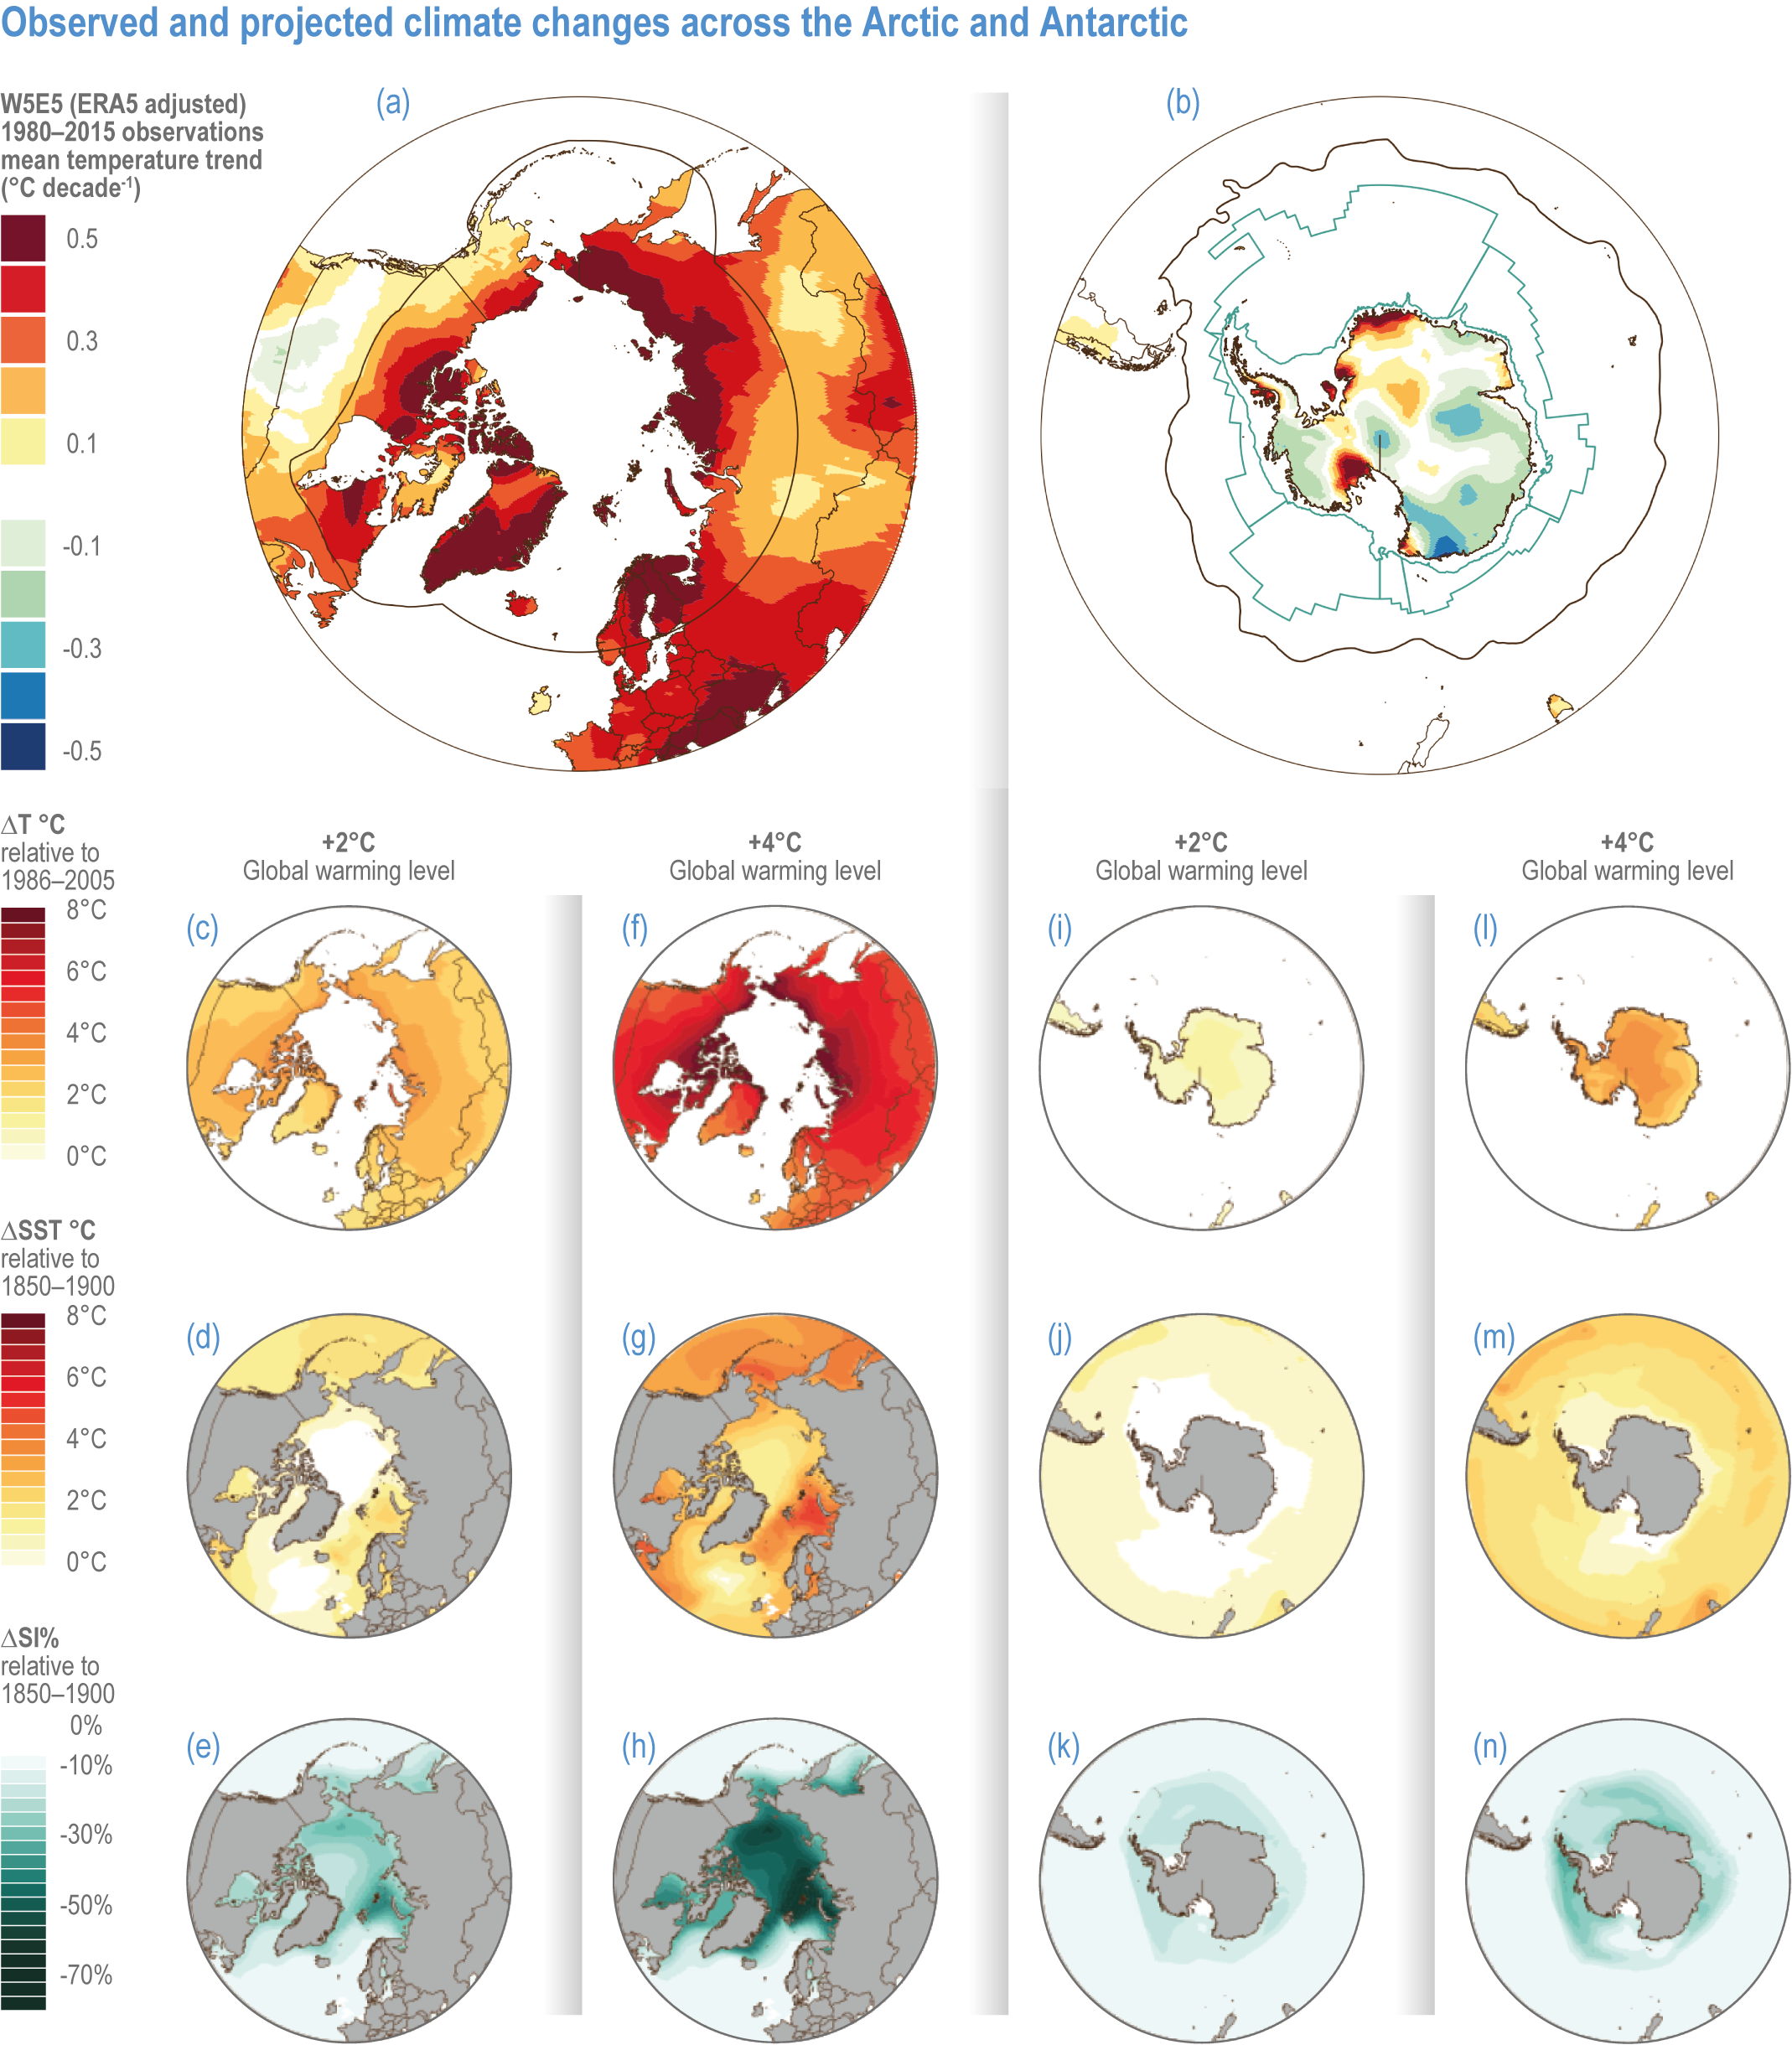
Figure caption
Figure CCP6.2 | Observed and projected climate changes across the Arctic (A, C–H) and Antarctic (B, I–N). Boundary lines in each plot are based on the polar regions defined in Figure CCP6.1. All data shown here are extracted from the IPCC WGI Interactive Atlas (Gutiérrez et al., 2021; Iturbide et al., 2021); data set details can be found in the Atlas (https://interactive-atlas.ipcc.ch/). Arctic (A) and Antarctic (B) are observed temperature trends (°C per decade) over land for the period 1980–2015, derived from ERA5 adjusted data set. Projected changes from an ensemble of CMIP6 projections: annual mean temperature over land is depicted for 2°C (C, I) and 4°C (F, L). Global warming levels (GWL) in the Arctic and Antarctic, respectively; annual mean sea surface temperature is depicted for 2°C (D, J) and 4°C (G, M) GWL in the Arctic and Antarctic respectively; annual sea ice (%) is depicted for 2°C (E, K) and 4°C (H, N) GWL in the Arctic and Antarctic, respectively.