Figure TS.4
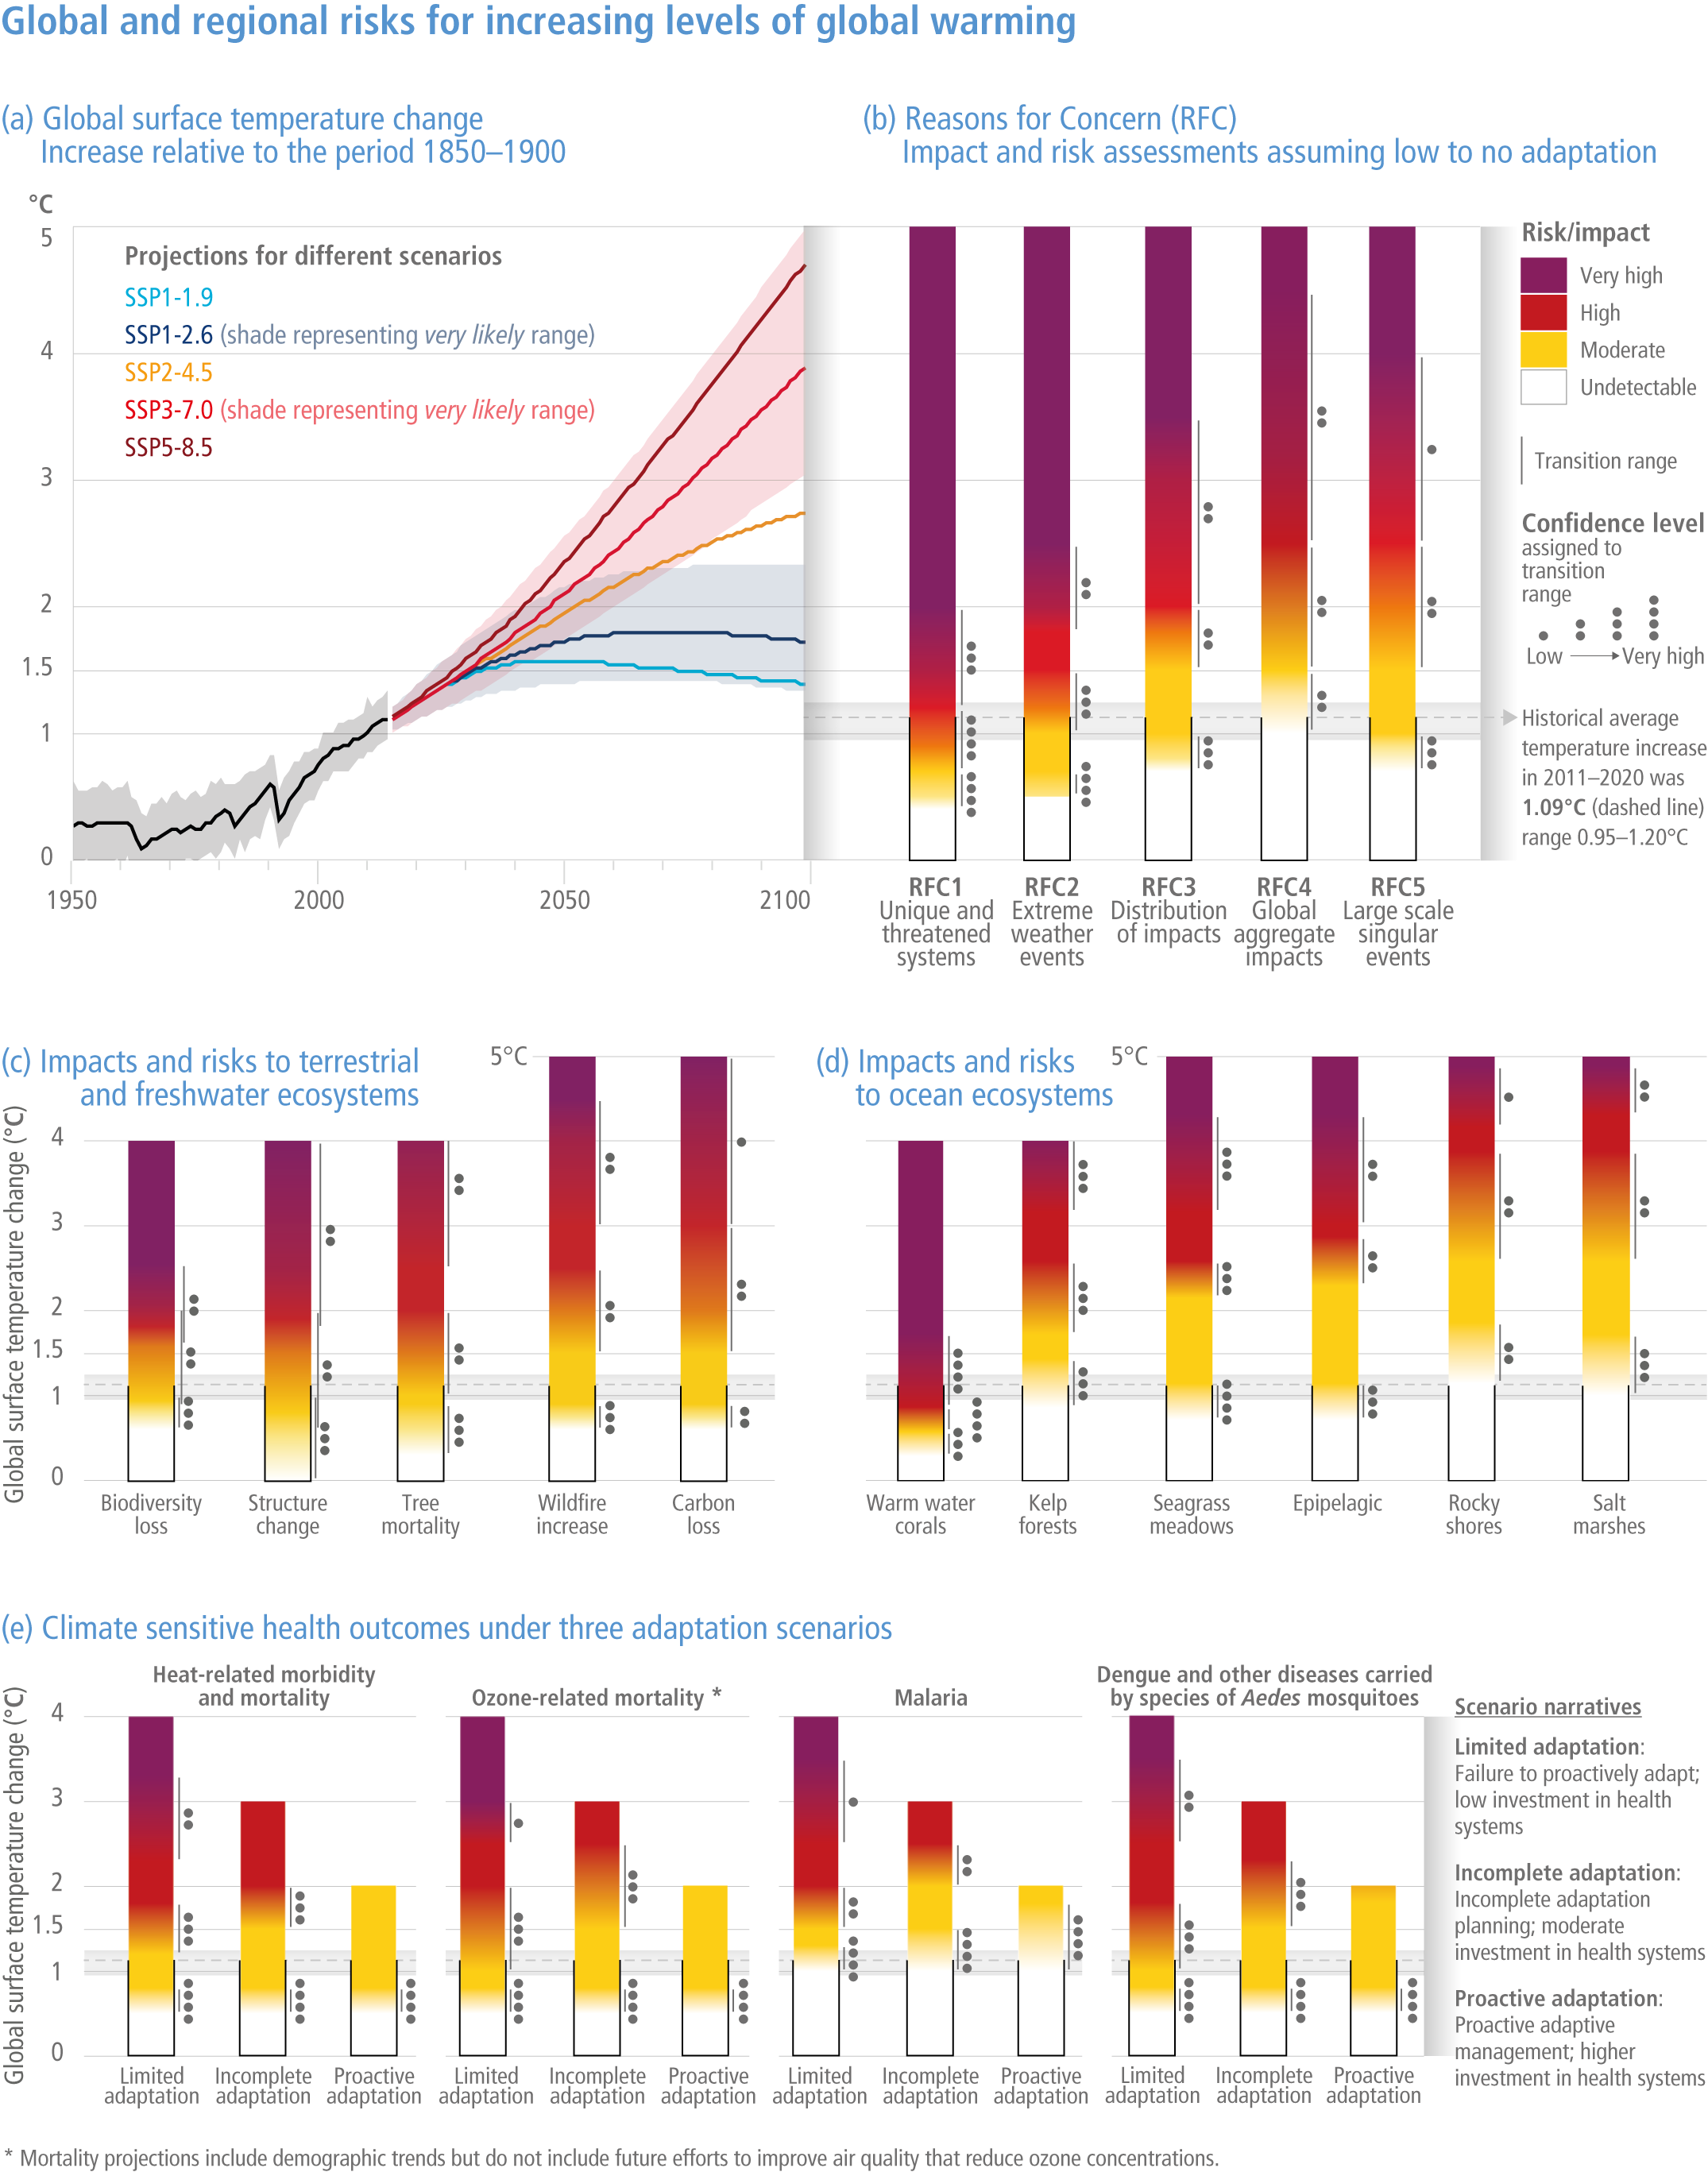
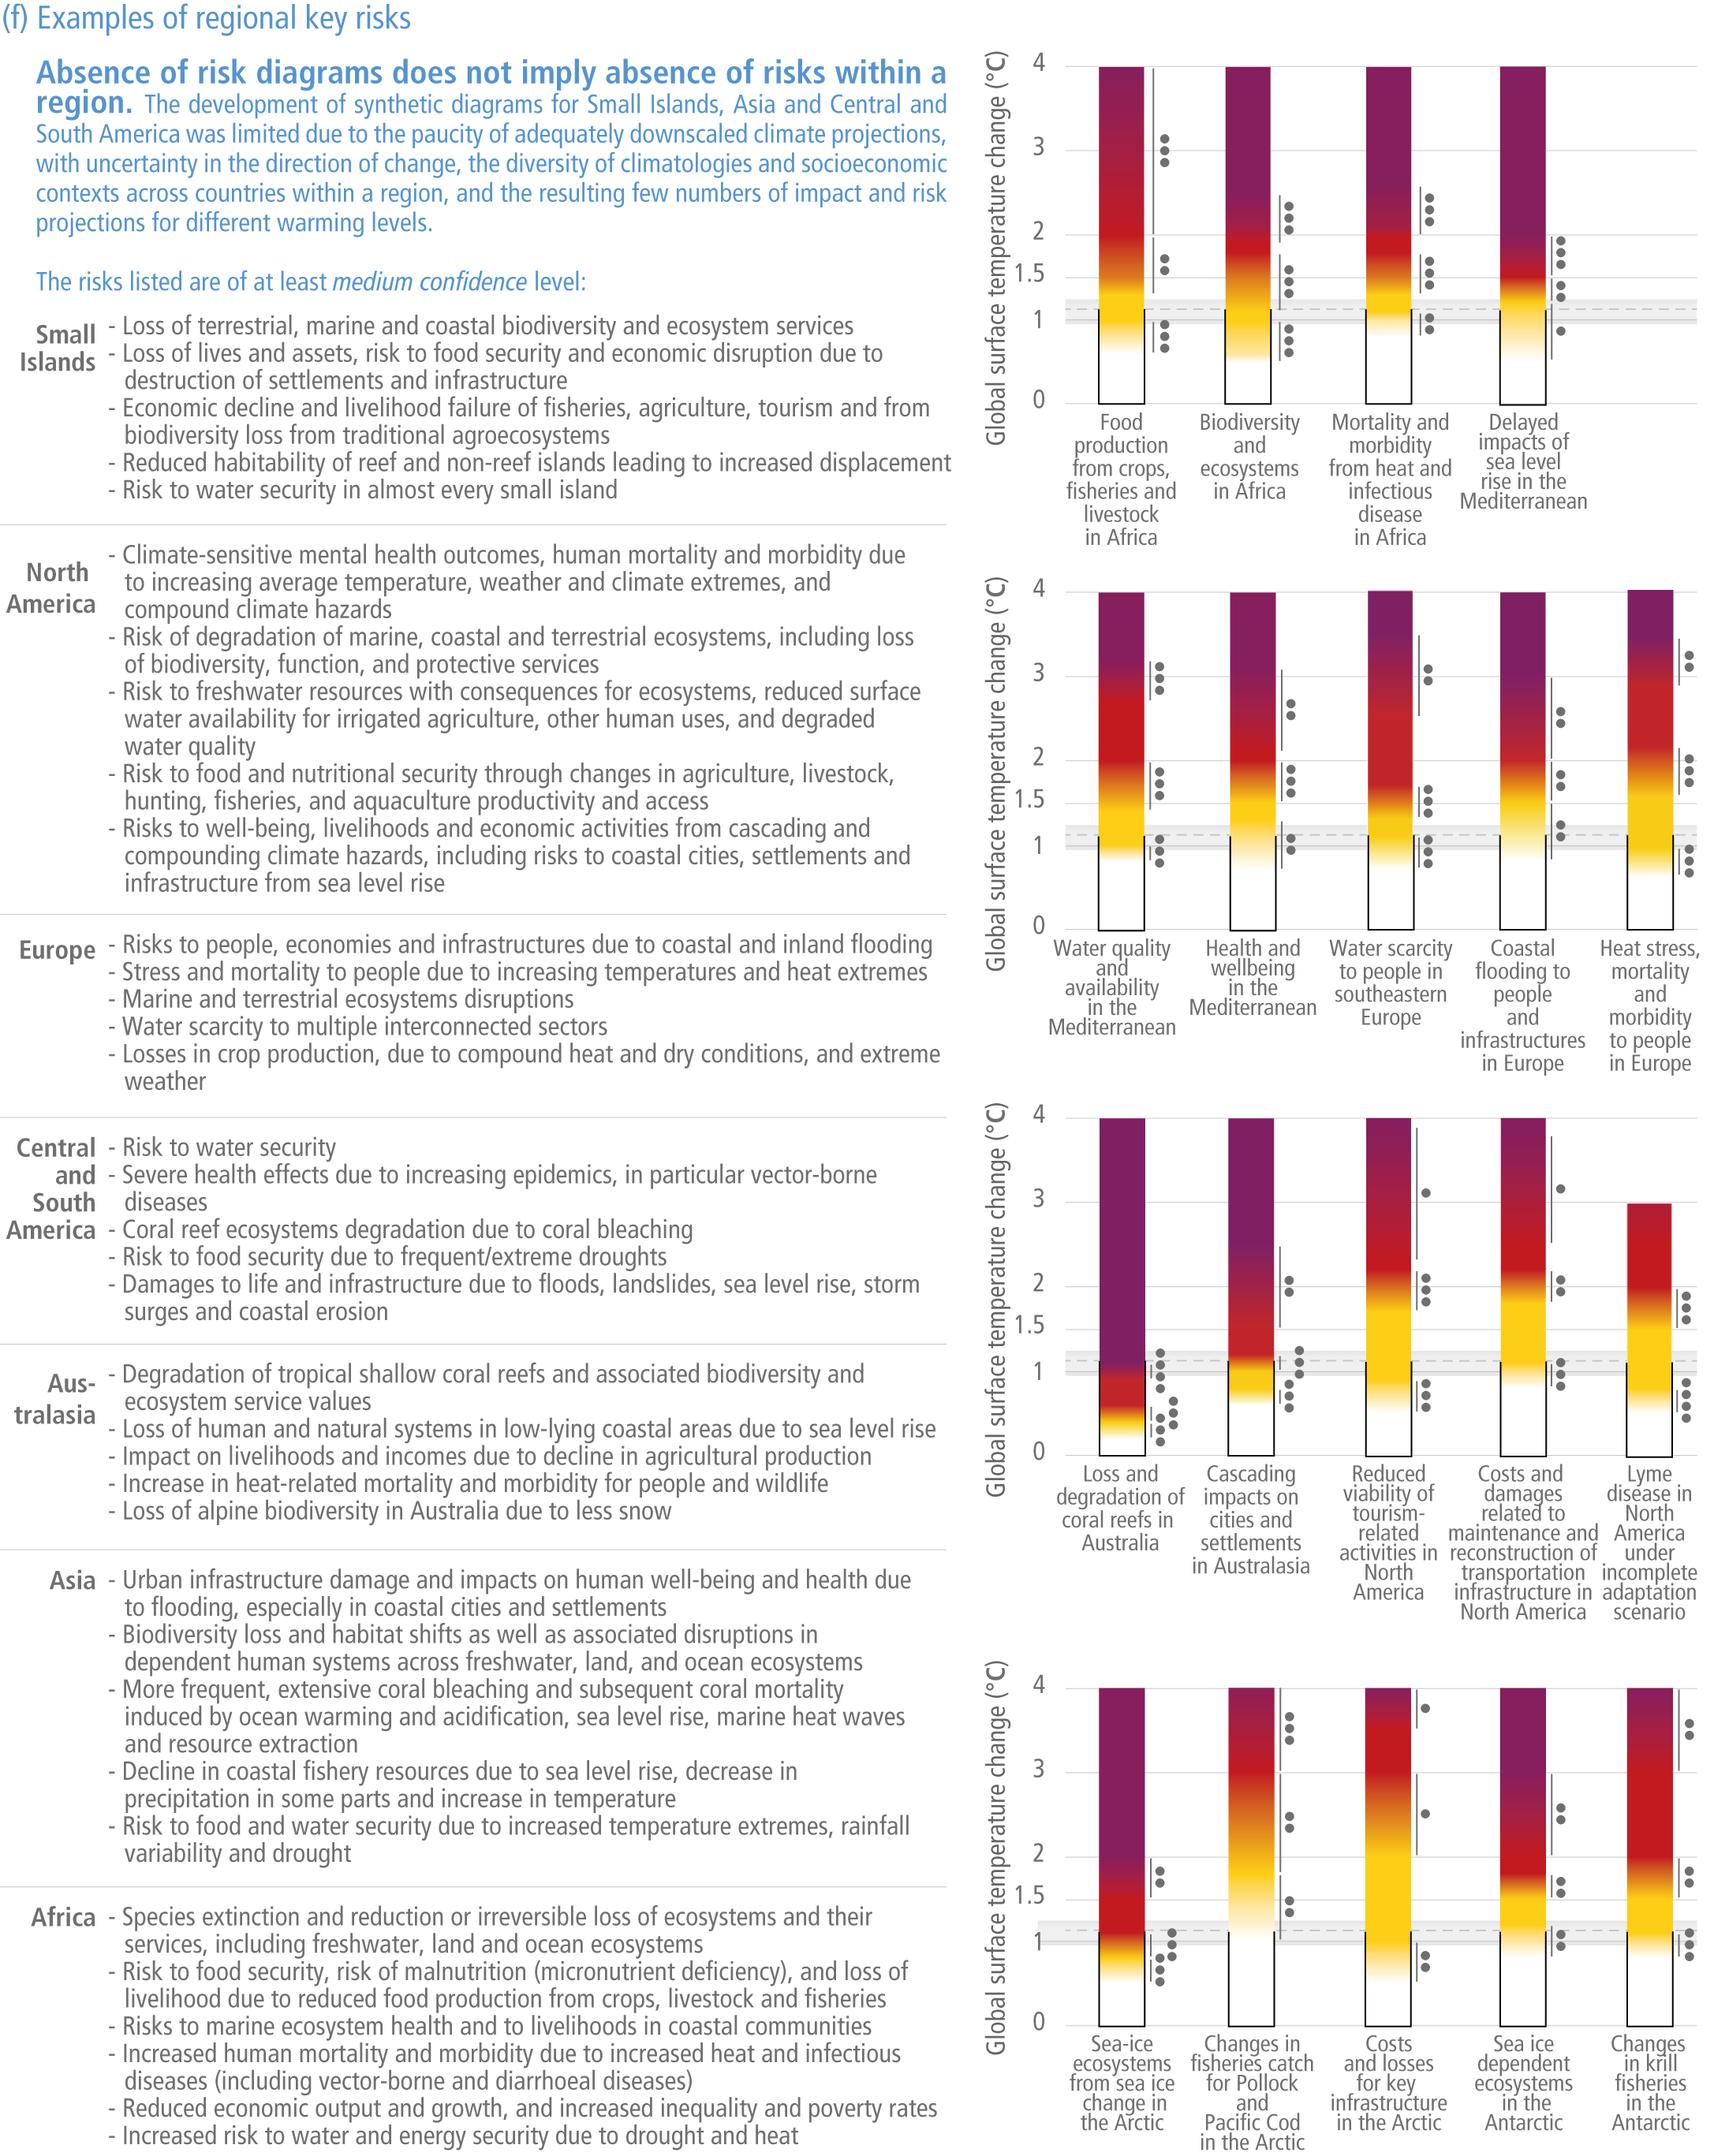
Figure caption
Figure TS.4 | Synthetic diagrams of global and sectoral assessments and examples of regional key risks. Diagrams show the change in the levels of impacts and risks assessed for global warming of 0–5°C global surface temperature change relative to pre-industrial period (1850–1900) over the range.
(a) Global surface temperature changes in °C relative to 1850–1900. These changes were obtained by combining CMIP6 model simulations with observational constraints based on past simulated warming, as well as an updated assessment of equilibrium climate sensitivity (Box TS.2). Changes relative to 1850–1900 based on 20-year averaging periods are calculated by adding 0.85°C (the observed global surface temperature increase from 1850–1900 to 1995–2014) to simulated changes relative to 1995–2014. Very likely ranges are shown for SSP1-2.6 and SSP3-7.0 (WGI AR6 Figure SPM.8). Assessments were carried out at the global scale for (b), (c), (d) and (e).
(b) The Reasons for Concern (RFC) framework communicates scientific understanding about accrual of risk for five broad categories. Diagrams are shown for each RFC, assuming low to no adaptation (i.e., adaptation is fragmented, localized and comprises incremental adjustments to existing practices). However, the transition to a very high risk level has an emphasis on irreversibility and adaptation limits. Undetectable risk level (white) indicates no associated impacts are detectable and attributable to climate change; moderate risk (yellow) indicates associated impacts are both detectable and attributable to climate change with at least medium confidence, also accounting for the other specific criteria for key risks; high risk (red) indicates severe and widespread impacts that are judged to be high on one or more criteria for assessing key risks; and very high risk level (purple) indicates very high risk of severe impacts and the presence of significant irreversibility or the persistence of climate-related hazards, combined with limited ability to adapt due to the nature of the hazard or impacts/risks. The horizontal line denotes the present global warming of 1.09°C which is used to separate the observed, past impacts below the line from the future projected risks above it. RFC1: Unique and threatened systems: ecological and human systems that have restricted geographic ranges constrained by climate-related conditions and have high endemism or other distinctive properties. Examples include coral reefs, the Arctic and its Indigenous Peoples, mountain glaciers and biodiversity hotspots. RFC2: Extreme weather events: risks/impacts to human health, livelihoods, assets and ecosystems from extreme weather events such as heatwaves, heavy rain, drought and associated wildfires, and coastal flooding. RFC3: Distribution of impacts: risks/impacts that disproportionately affect particular groups due to uneven distribution of physical climate change hazards, exposure or vulnerability. RFC4: Global aggregate impacts: impacts to socio-ecological systems that can be aggregated globally into a single metric, such as monetary damages, lives affected, species lost or ecosystem degradation at a global scale. RFC5: Large-scale singular events: relatively large, abrupt and sometimes irreversible changes in systems caused by global warming, such as ice sheet disintegration or thermohaline circulation slowing. Assessment methods are described in SM16.6 and are identical to AR5, but are enhanced by a structured approach to improve robustness and facilitate comparison between AR5 and AR6. Risks for (c) terrestrial and freshwater ecosystems and (d) ocean ecosystems.
For (c) and (d) , diagrams shown for each risk assume low to no adaptation. The transition to a very high risk level has an emphasis on irreversibility and adaptation limits.
(e) Climate-sensitive human health outcomes under three scenarios of adaptation effectiveness. The assessed projections were based on a range of scenarios, including SRES, CMIP5, and ISIMIP, and, in some cases, demographic trends. The diagrams are truncated at the nearest whole °C within the range of temperature change in 2100 under three SSP scenarios in panel (a).
(f) Examples of regional key risks. Risks identified are of at least medium confidence level. Key risks are identified based on the magnitude of adverse consequences (pervasiveness of the consequences, degree of change, irreversibility of consequences, potential for impact thresholds or tipping points, potential for cascading effects beyond system boundaries); likelihood of adverse consequences; temporal characteristics of the risk; and ability to respond to the risk, e.g., by adaptation. The full set of 127 assessed global and regional key risks is given in SMTS.4 and SM16.7. Diagrams are provided for some risks. The development of synthetic diagrams for Small Islands, Asia and Central and South America were limited by the availability of adequately downscaled climate projections, with uncertainty in the direction of change, the diversity of climatologies and socio-economic contexts across countries within a region, and the resulting low number of impact and risk projections for different warming levels. Absence of risks diagrams does not imply absence of risks within a region. (Box TS.2) {`{`}Figure 2.11, Figure SM3.1, Figure 7.9, Figure 9.6, Figure 11.6, Figure 13.28, 16.5, 16.6, Figure 16.15, SM16.3, SM16.4, SM16.5, SM16.6 (methodologies), SM16.7, Figure CCP4.8, Figure CCP4.1 0, Figure CCP6.5, WGI AR6 2, WGI AR6 SPM A.1.2, WGI AR6 Figure SPM.8{`}`}