Back chapter figures
Figure TS.AII.3
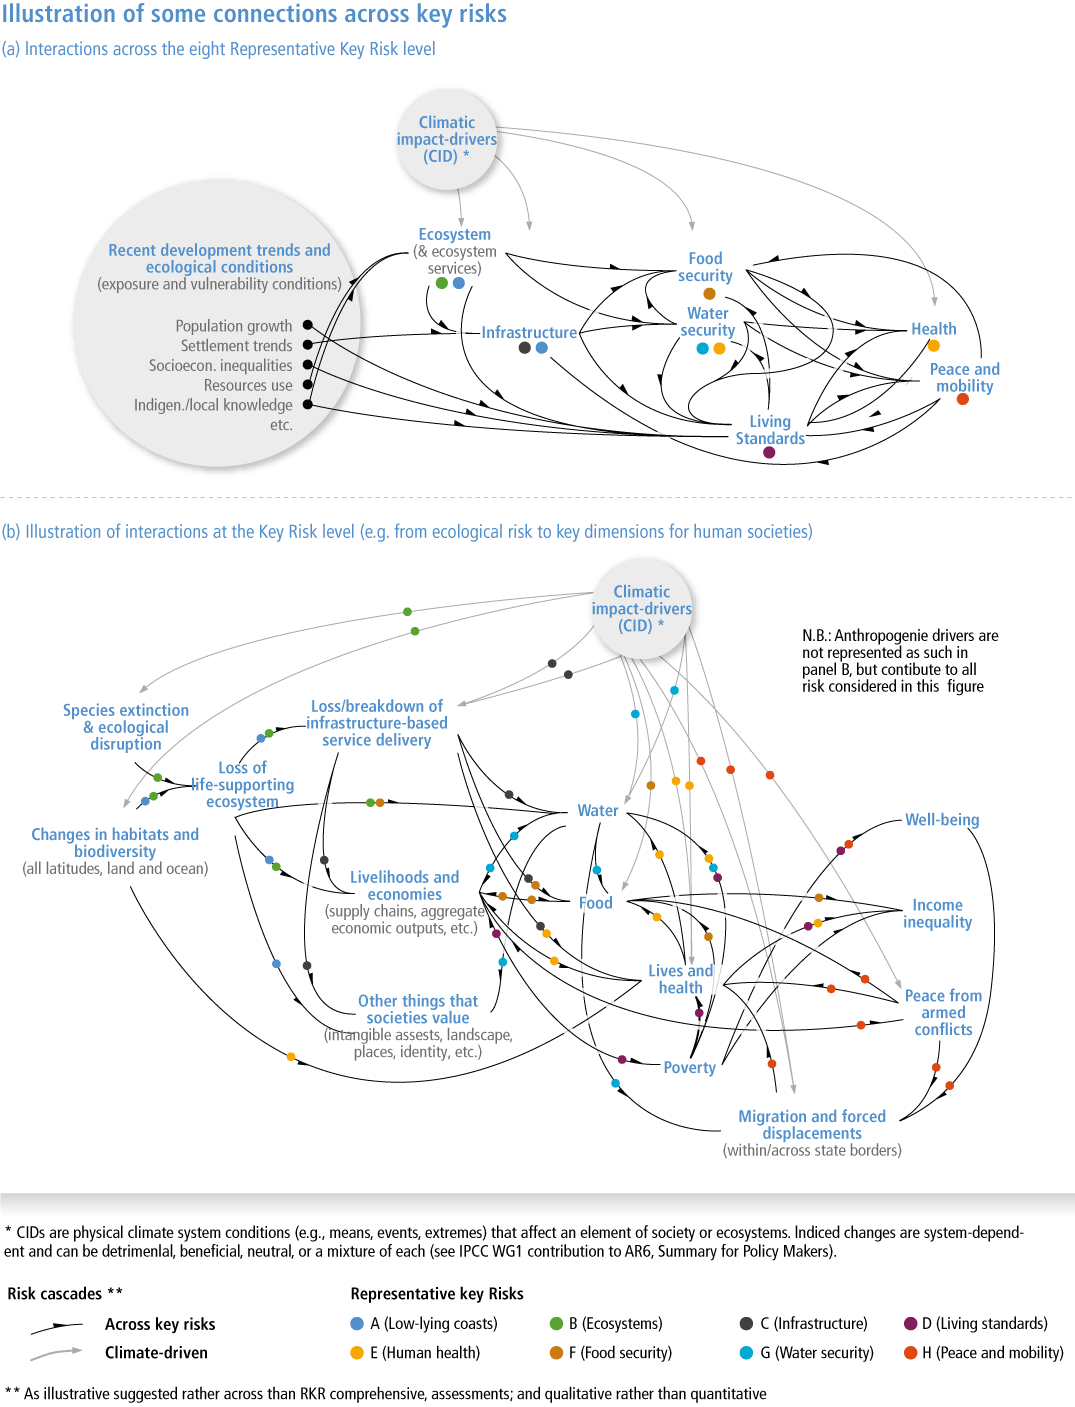
Figure caption
Figure TS.AII.3 | Illustration of some connections across key risks. Panel A describes all the cross-RKR risk cascades that are described in RKR assessments (Sections 16.5.2.3.2 to 16.5.2.3.9). Panel B provides an illustration of such interactions at the key risk level, for example from ecological risk to key dimensions for human societies (building on Section 16.5.2.2 and Table 16.A.4). The arrows are representative of interactions as qualitatively identified; they do not result from any quantitative modelling exercise. {`{`}Figure 16.11{`}`}