Figure 1.2
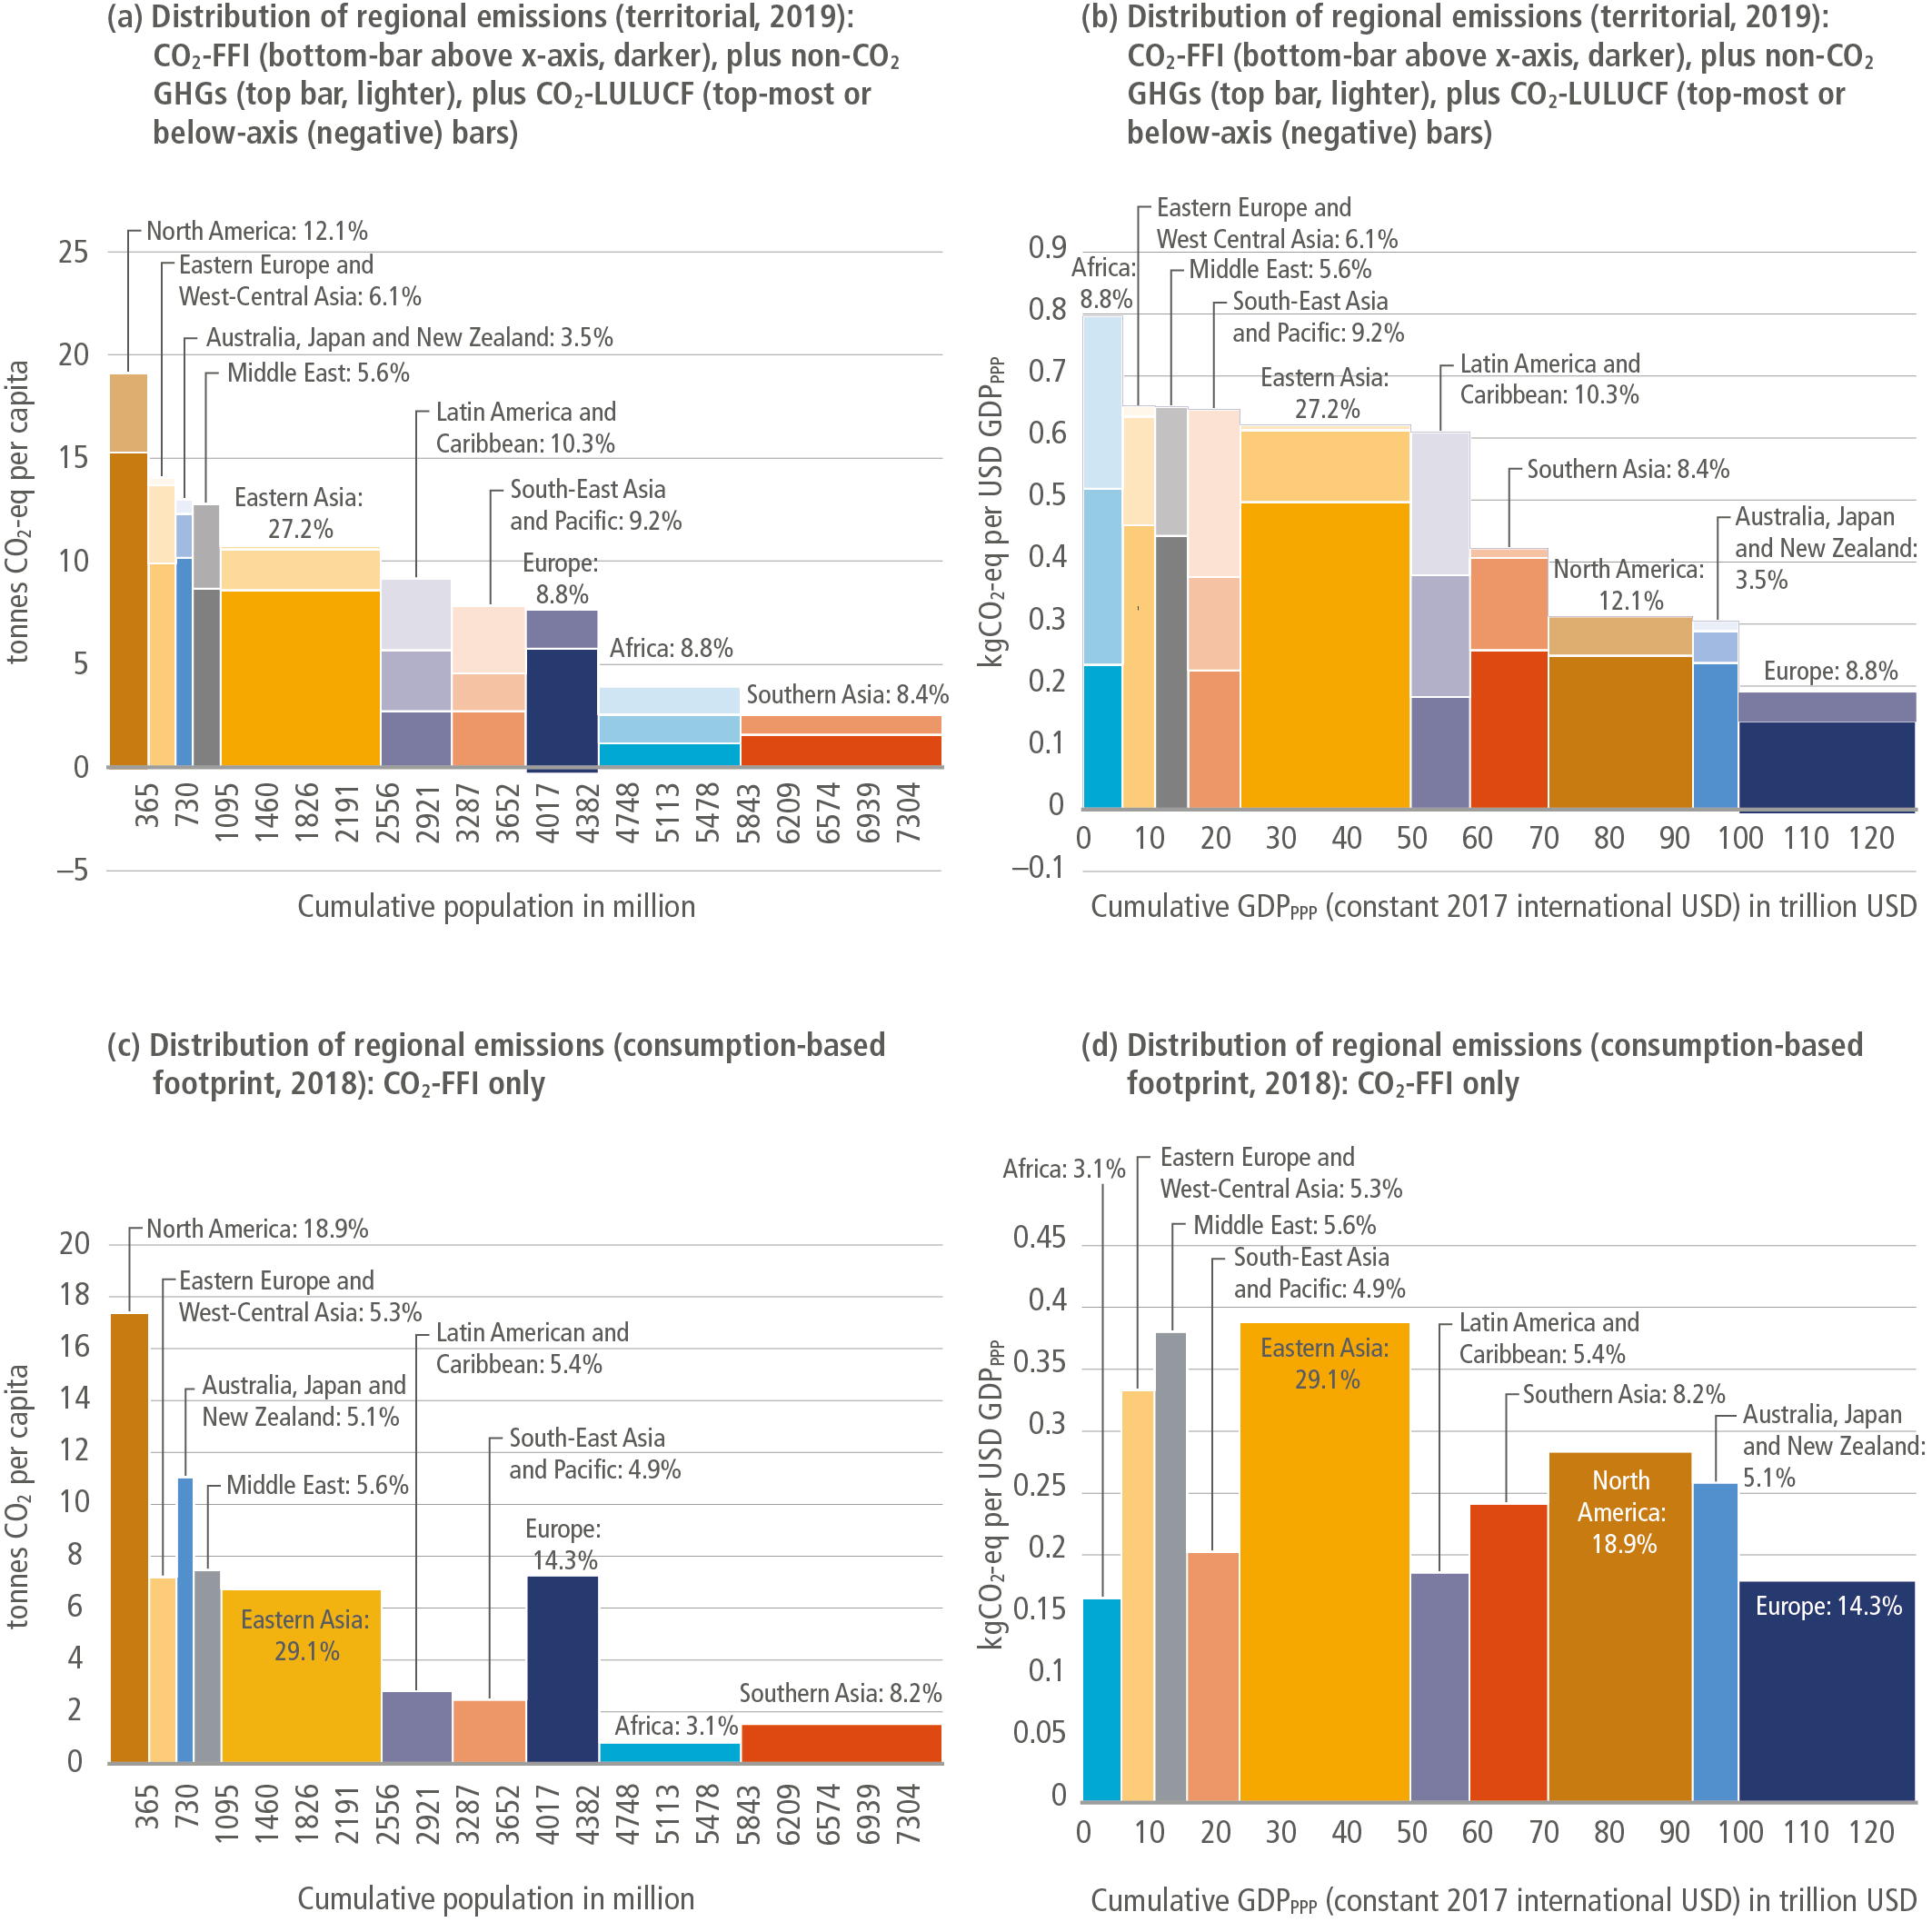
Figure caption
Figure 1.2 | Distribution of regional greenhouse gas (GHG) emissions for 10 broad global regions according to territorial accounting (panels (a) and (b), GHG emissions) and consumption-based accounting (panels (c) and (d), CO2-FFI emissions only). GHG emissions are categorised into: fossil fuel and industry (CO2-FFI); land use, land-use change and forestry (CO2-LULUCF); and other greenhouse gases (methane, nitrous oxide and F-gas – converted to 100-year global warming potentials). Per-capita GHGs for territorial (panel a) and CO2-FFI emissions vs population for consumption-based accounting (panel c). Panels (b) and (d): GHG emissions per unit GDPppp vs GDPppp, weighted with purchasing power parity for territorial accounting (panel b), CO2-FFI emissions per unit GDPppp for consumption-based accounting (panel d). The area of the rectangles refers to the total emissions for each regional category, with the height capturing per-capita emissions (panels a and c) or emissions per unit GDPppp (panels (b) and (d)), and the width proportional to the population of the regions and GDPppp. Emissions from international aviation and shipping (2.4% of the total GHG emissions) are not included.