Figure 1.6
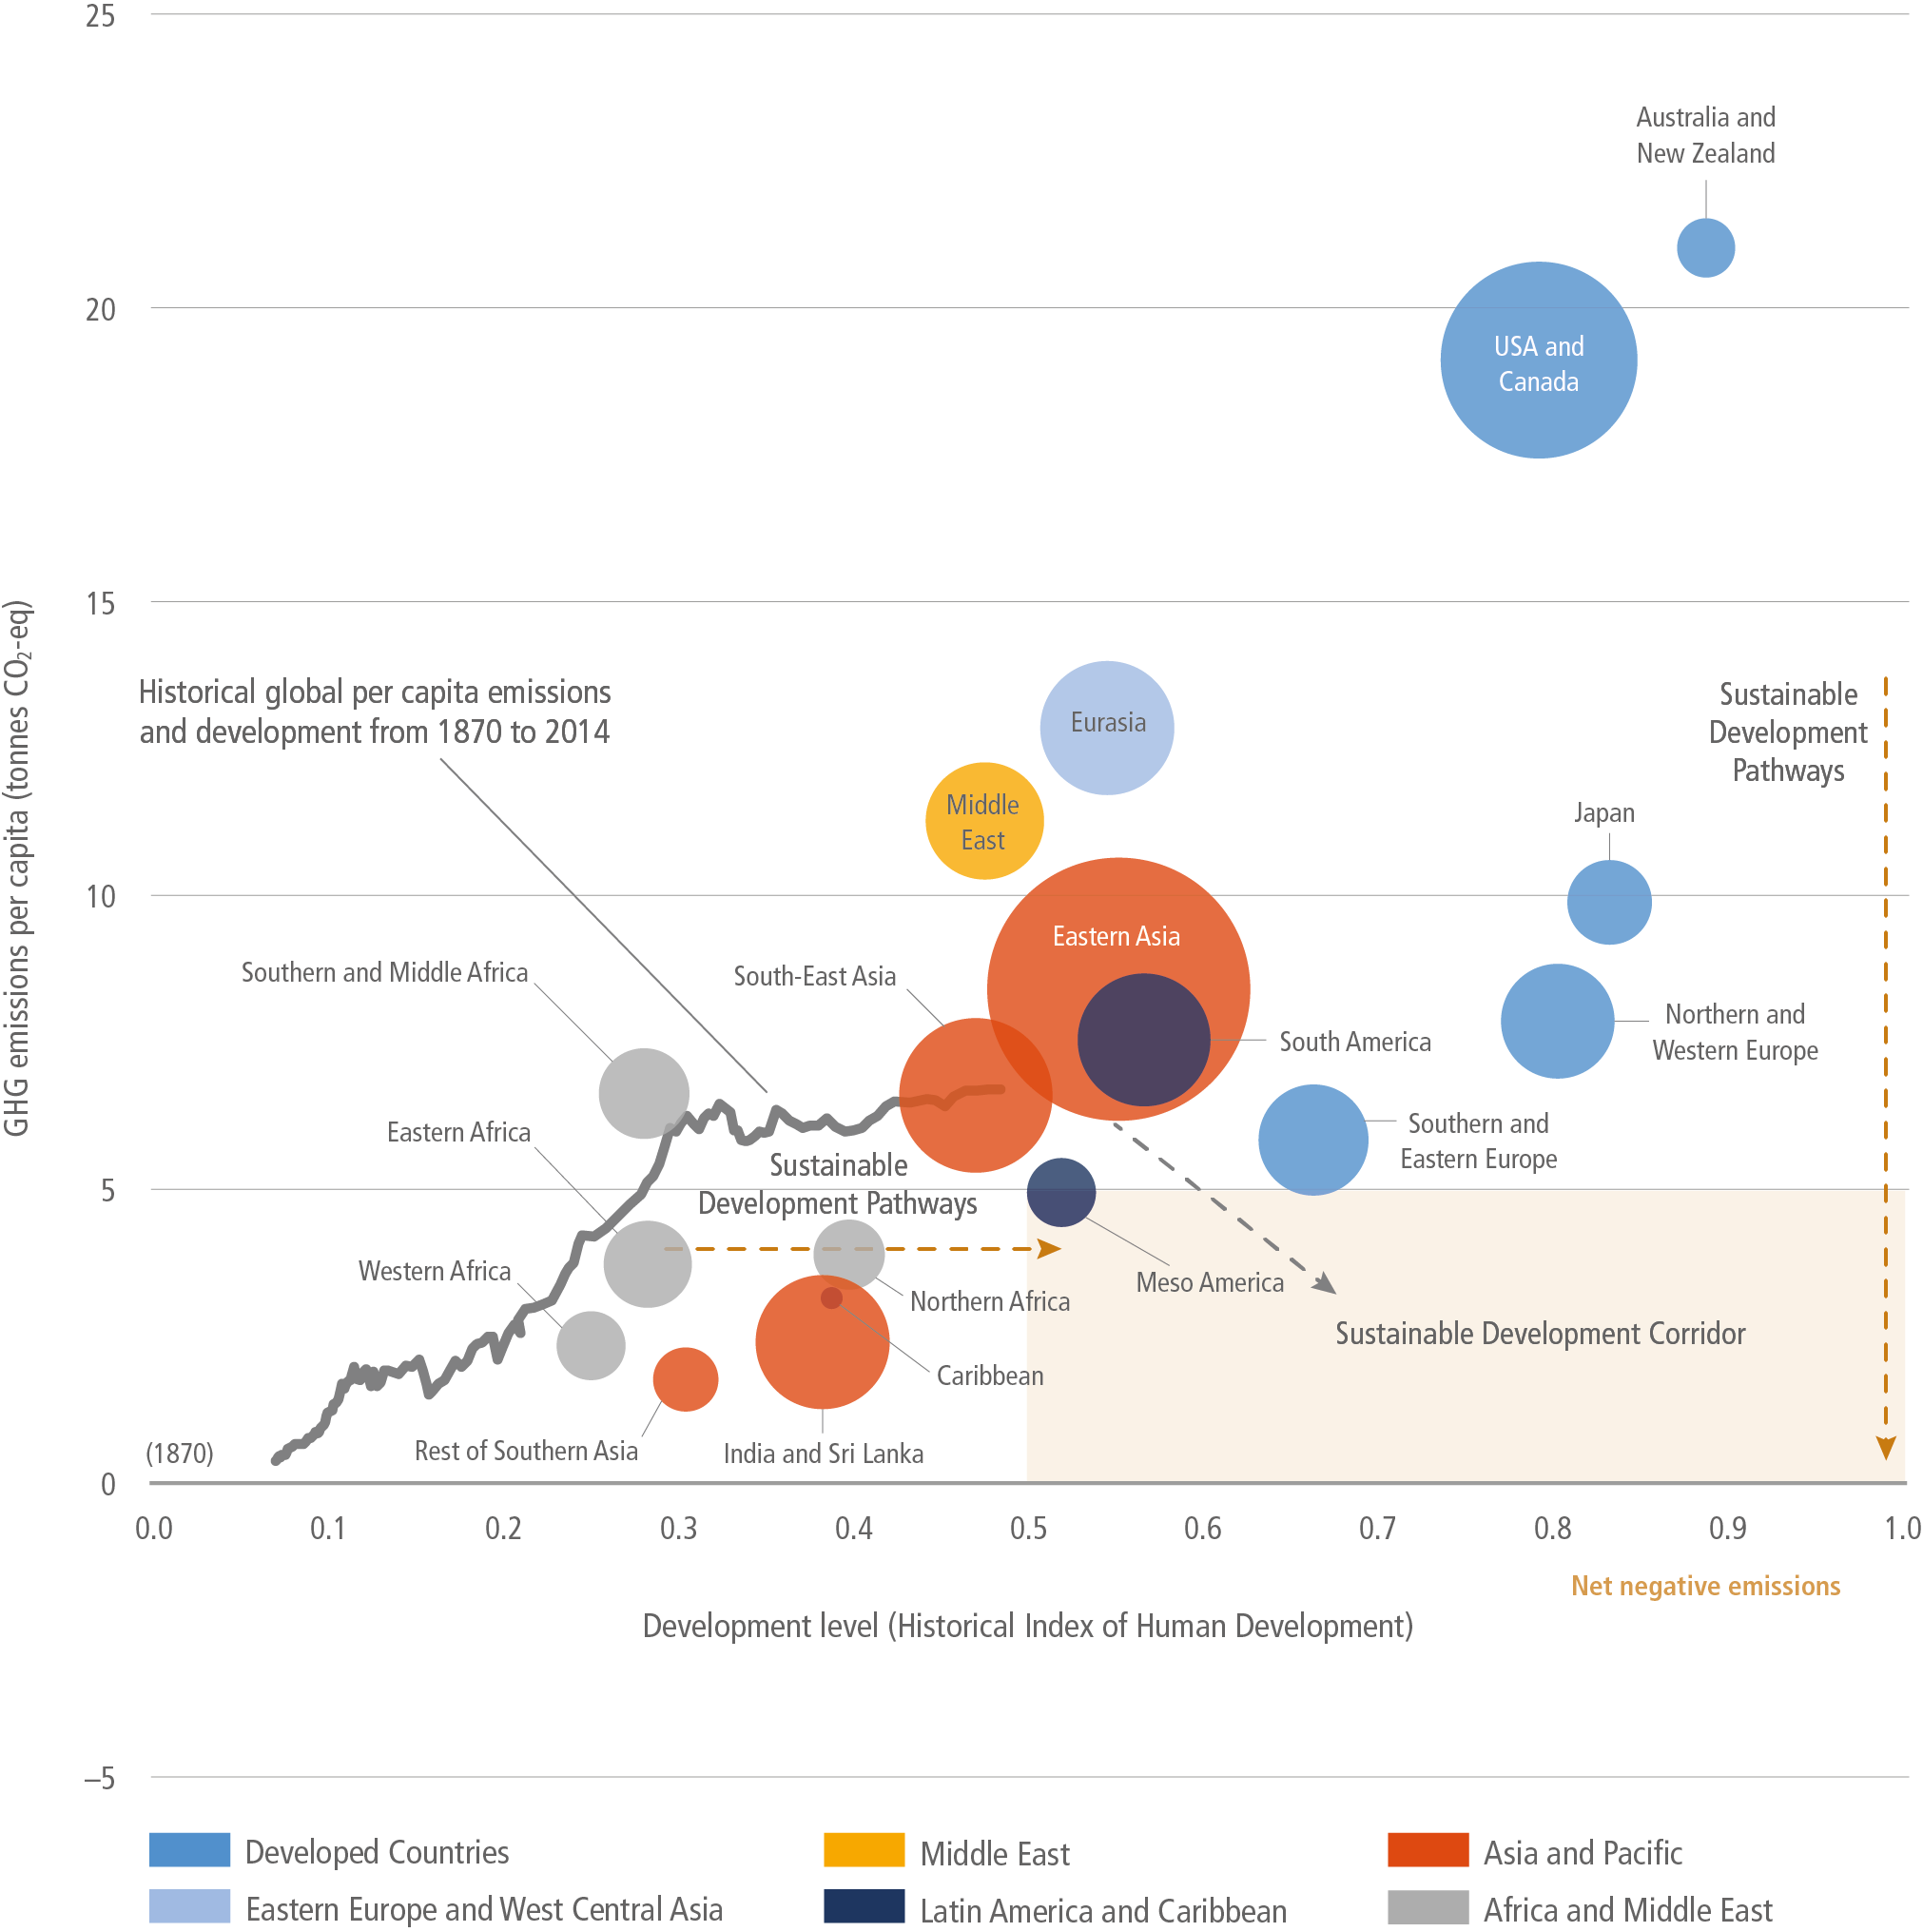
Figure caption
Figure 1.6 | Sustainable development pathways towards fulfilling the Sustainable Development Goals (SDGs). The graph shows global average per-capita GHG emissions (vertical axis) and relative ‘Historic Index of Human Development’ (HIHD) levels (horizontal) have increased globally since the industrial revolution (grey line). The bubbles on the graph show regional per-capita GHG emissions and human development levels in the year 2015, illustrating large disparities. Pathways towards fulfilling the Paris Agreement (and SDG 13) involve global average per-capita GHG emissions below about 5 tCO2-eq by 2030. Likewise, to fulfil SDGs 3, 4 and 8, HIHD levels (see footnote 7) need to be at least 0.5 or greater. This suggests a ‘sustainable development zone’ for year 2030 (in pale brown); the in-figure text also suggests a ‘sustainable development corridor’, where countries limit per-capita GHG emissions while improving levels of human development over time. The emphasis of pathways into the sustainable development zone differ (dashed brown arrows), but in each case transformations are needed in how human development is attained while limiting GHG emissions.