Back to chapter figures
Box 10.4, Figure 1
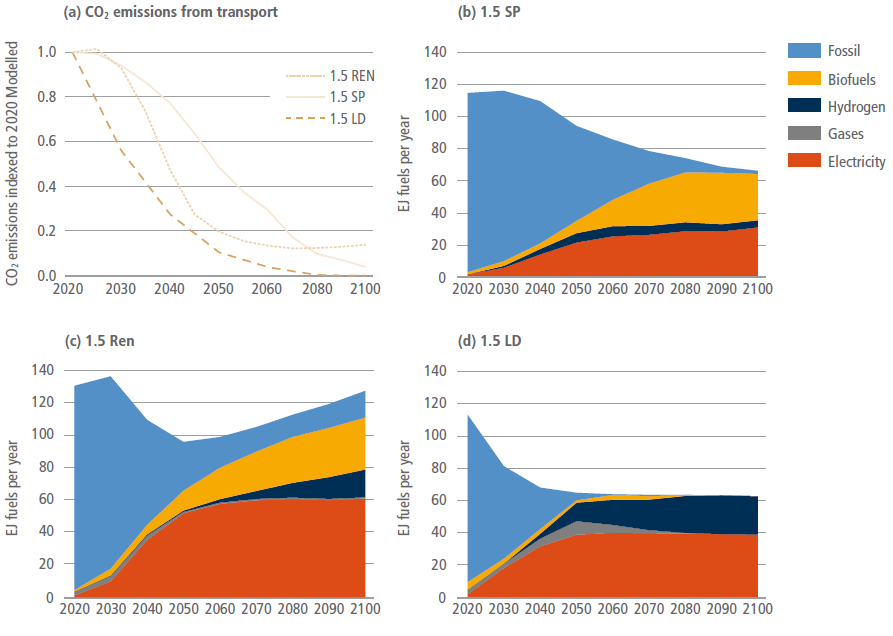
Figure caption
Box 10.4, Figure 1 | Three Illustrative mitigation pathways for the Transport sector. Panel (a) shows CO2 emissions from the transport sector indexed to simulated non-COVID-2019 2020 levels. Panels (b), (c), and (d) show fuels mix to achieve 1.5°C warming through three illustrative mitigation pathways: IMP-SP, 1.5 IMP-Ren and IMP-LD, respectively. All data from IPCC AR6 scenario database.