Figure 10.15
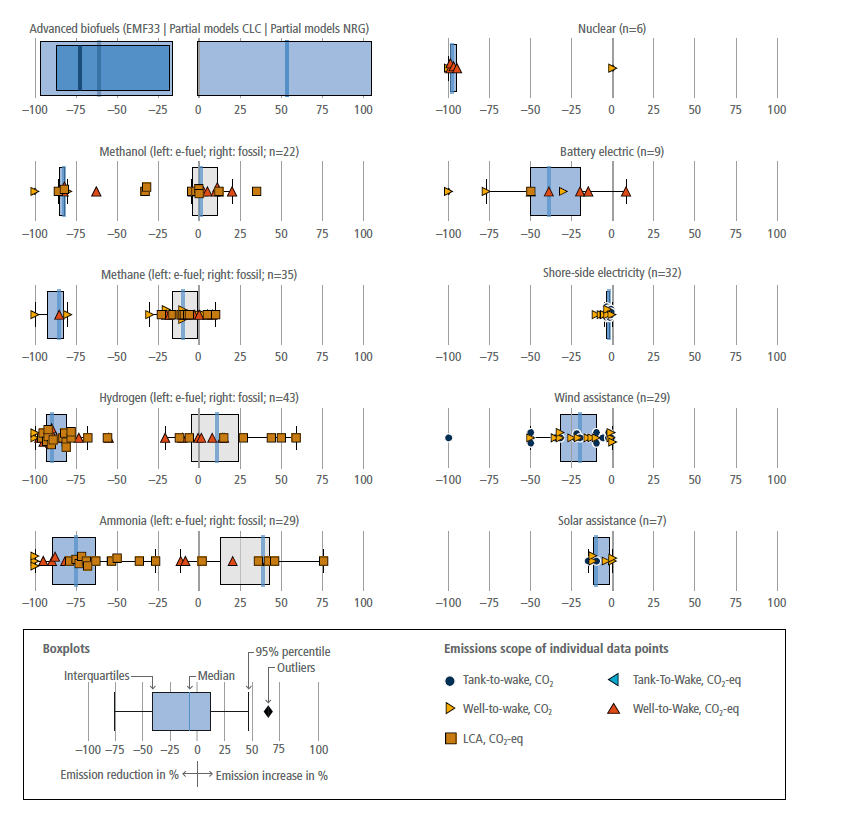
Figure caption
Figure 10.15 | Emissions reductions potential of alternative fuels compared to conventional fuels in the shipping sector. The x-axis is reported in %. Each individual marker represents a data point from the literature, where the brown square indicates a full LCA CO2-eq value; light blue triangles tank-to-wake CO2-eq; red triangles well-to-wake CO2-eq; yellow triangles well-to-wake CO2; and dark blue circles tank-to-wake CO2 emissions reduction potentials. The values in the Figure rely on the 100-year GWP value embedded in the source data, which may differ slightly with the updated 100-year GWP values from WGI. ‘n’ indicates the number of data points per sub-panel. Grey shaded boxes represent data where the energy comes from fossil resources, and blue from low-carbon renewable energy sources. ‘Advanced biofuels EMF33’ refers to emissions factors derived from simulation results from the integrated assessment models EMF33 scenarios (darkest coloured box in top left panel). Biofuels partial models CLC refers to partial models with constant land cover. Biofuels partial models NRG refers to partial models with natural regrowth. For ammonia and hydrogen, low-carbon fuel is produced via electrolysis using low-carbon electricity, and ‘fossil’ refers to fuels produced via steam methane reforming of natural gas.