Back to chapter figures
Figure 10.17
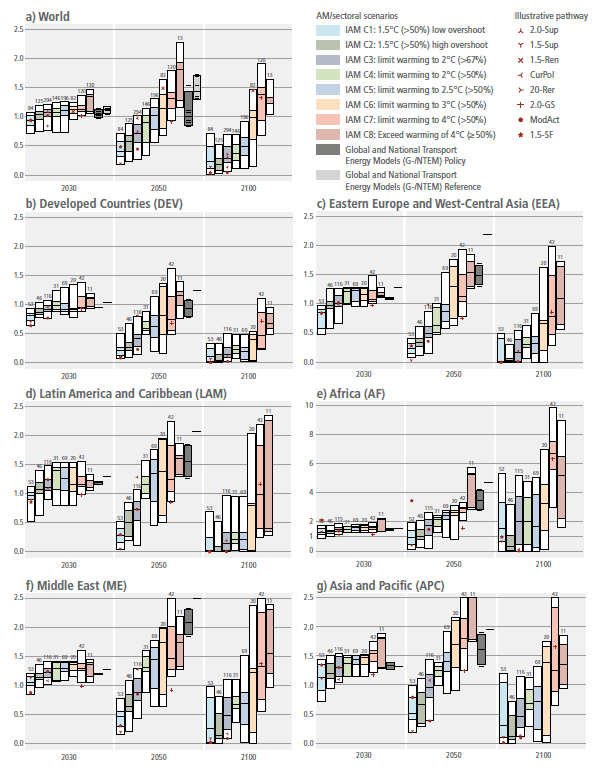
Figure caption
Figure 10.17 | Direct CO2 emissions from transport in 2030, 2050, and 2100 indexed to 2020 modelled year across R6 Regions and World. IAM results are grouped by temperature targets. Sectoral studies are grouped by reference and policy categories. Plots show 5–95th percentile, 25–75th percentile, and median. Numbers above the bars indicate the number of scenarios. Data from the AR6 scenario database.