Back to chapter figures
Figure 10.20
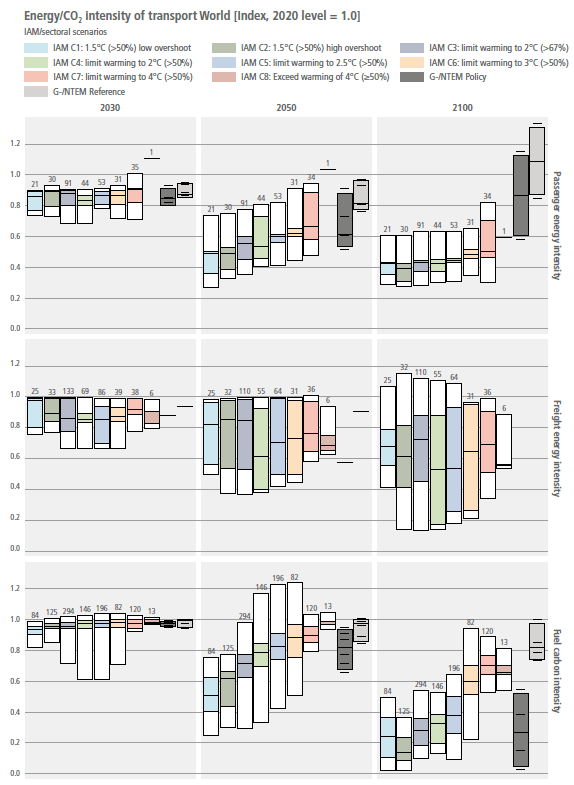
Figure caption
Figure 10.20 | Energy efficiency and carbon intensity of transport in 2030, 2050, and 2100 indexed to 2020 modelled year across scenarios. Plots show 5th/95th percentile, 25th/75th percentile, and median. Numbers above the bars indicate the number of scenarios. Data from the AR6 scenario database.